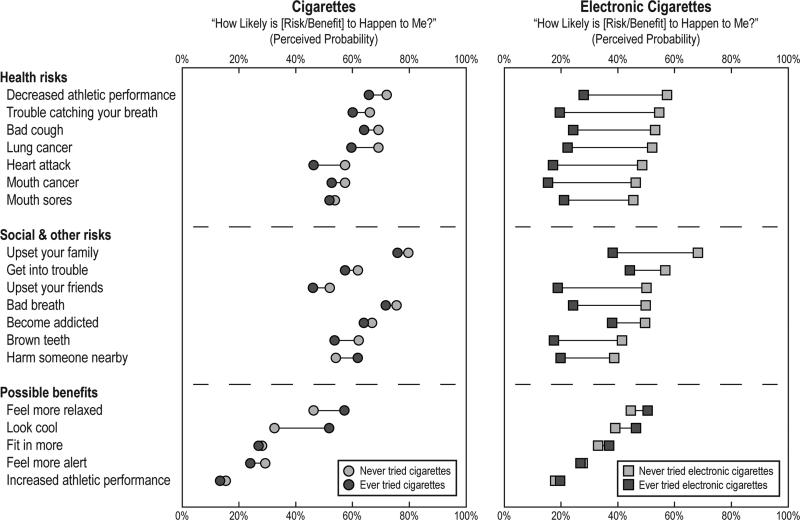
Figure 2. Adjusted Mean Perceived Risks and Benefits for Use of Cigarettes and Electronic Cigarettes, Among Ever-Users and Never-Users of Each Product.
The figure shows adjusted mean perceived probabilities for each of 19 possible outcomes among male high school students. Probabilities indicate the reported likelihood with which respondents believed each outcome would happen to them if they were to use cigarettes (circles) or electronic cigarettes (squares). For each product, responses are separated for ever-users of each product (dark gray) and never-users (light gray).

