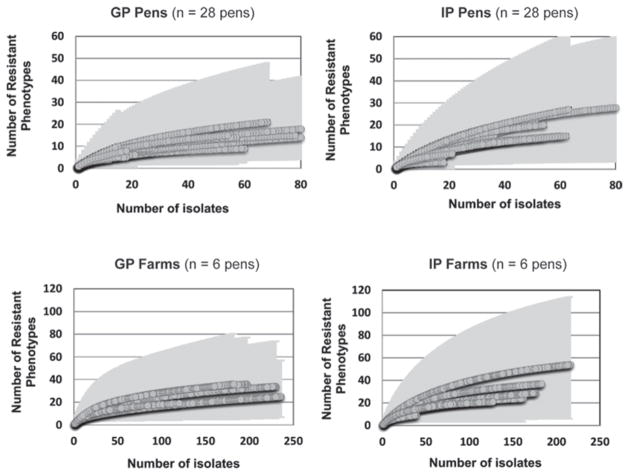
Figure 1.
Rarefaction curves for the number of Escherichia coli antimicrobial drug susceptibility phenotypes. Shaded area corresponds to a 95% CI. Calves housed in group pens (GP) had 3 to 25 calves fed free-choice acidified milk. Calves housed in individual pens (IP) had no direct contact with neighboring calves and were fed milk or milk replacer 2 to 3 times a day.

