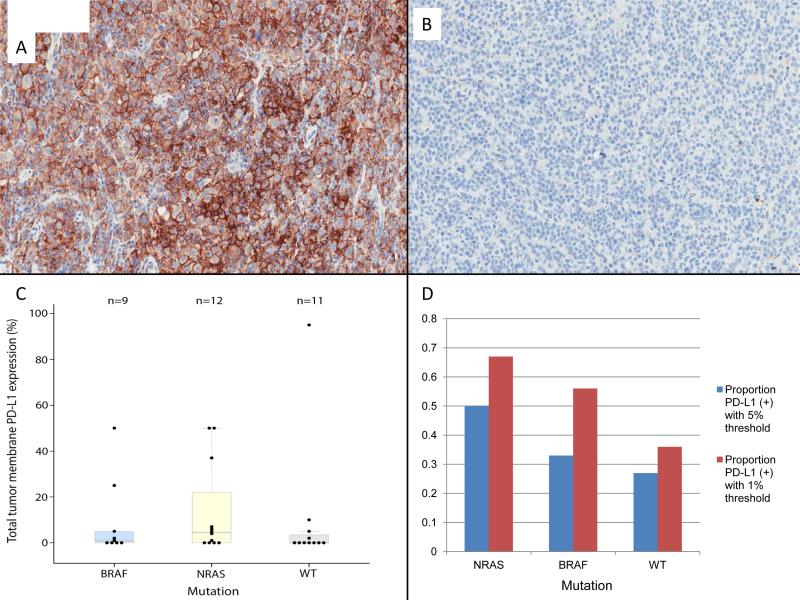
Figure 2.
Immunohistochemical analysis of tumor cell-surface expression of PD-L1 from representative samples (20x). Panel A shows an NRAS-mutant melanoma sample with strongly positive expression (~50% of cells); Panel B shows a WT melanoma with <1% of cells with PDL1 expression. Panel C shows the distribution of PD-L1 staining by genotype. Panel D shows number of samples evaluated by genotype and whether they were positive for PD-L1 expression (≥5%) or negative (<5%).

