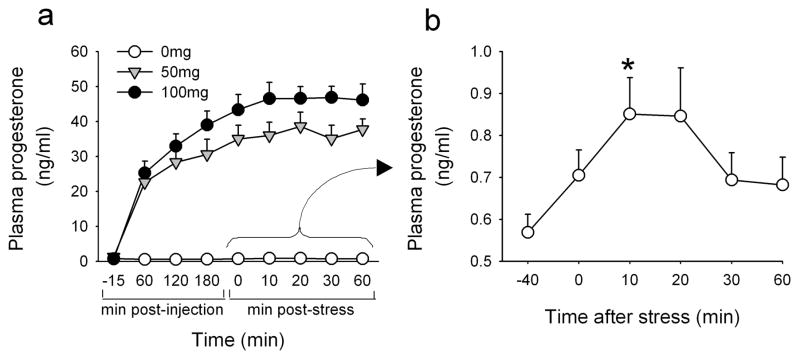
Figure 3. Plasma progesterone levels as a function of time among individuals treated with 0, 50 and 100mg progesterone (a) and changes in plasma progesterone after the TSST among individuals treated with 0mg progesterone (b).
Data points indicate mean±SEM values at repeated times before and after the TSST. Asterisks indicate a significant difference from −40min (Student’s paired t-test with Bonferroni correction, p<0.001).

