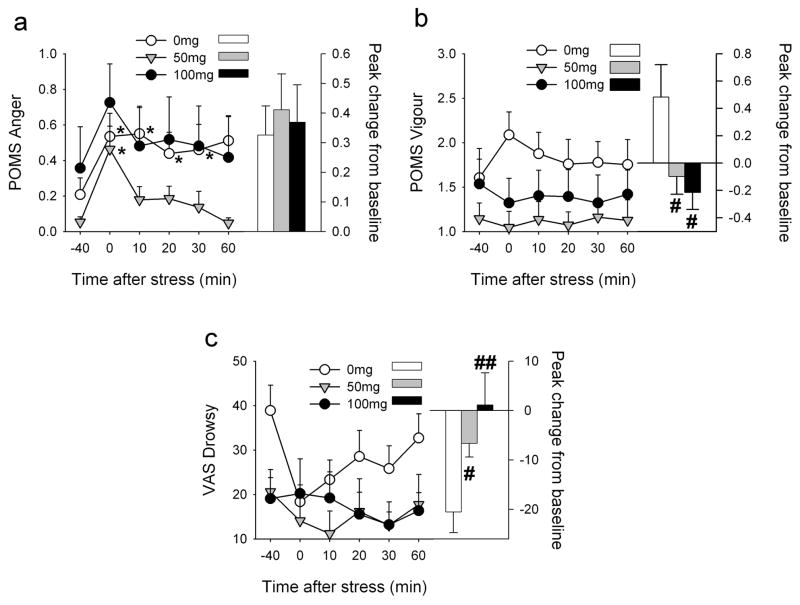
Figure 4. Effects of the TSST upon POMS Anger (a), Vigour (b) and VAS Drowsy (c) among individuals treated with 0, 50 and 100mg progesterone.
Data points indicate mean±SEM values at repeated times before and after the TSST (left axis) and bars indicate the peak change from −40min (right axis). Asterisks indicate a significant difference from −40min (Student’s paired t-test with Bonferroni correction, p<0.001). # indicates a significant difference from 0mg (Student’s unpaired t-test, #p<0.05 ##p<0.01).

