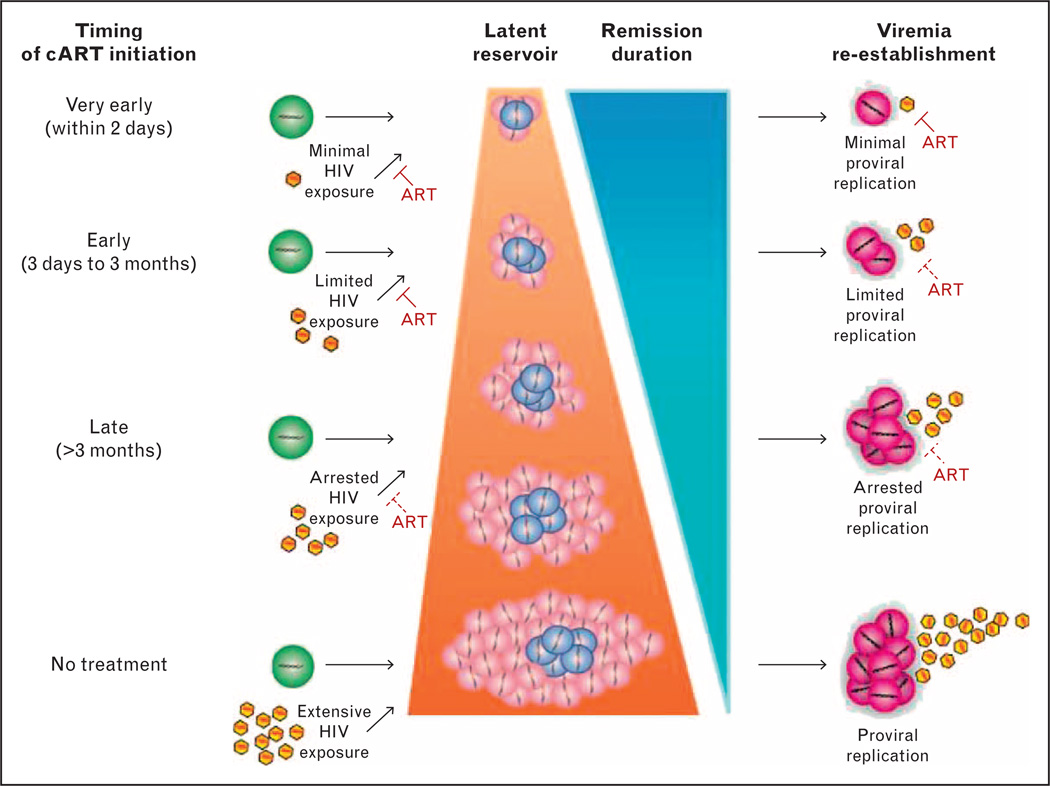
FIGURE 1.
Reservoir size and duration of HIV remission is directly affected by the time from HIV infection to initiation of cART. Susceptible CD4+ T cells (green) become infected with HIV (yellow) and transition to either productively infected CD4+ T cells (pink) or latently infected CD4+ T cells (blue). Reactivated CD4+ T cells (purple) from latency re-establish viremia. ART, antiretroviral therapy; cART, combination antiretroviral therapy.

