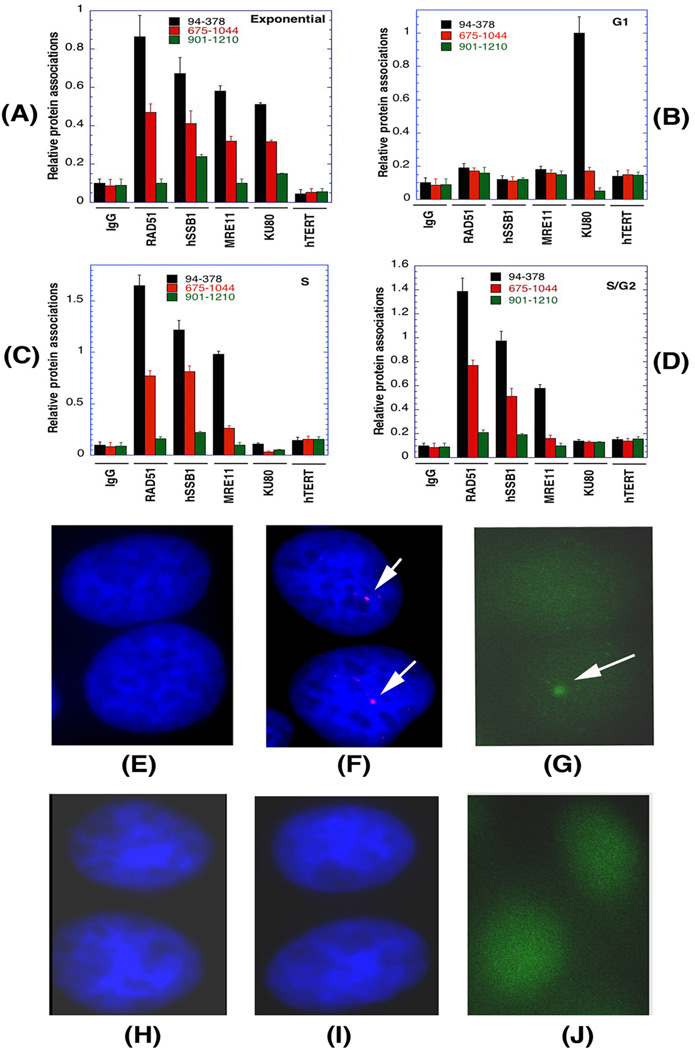
Fig. 6. Localization of repair proteins and hTERT to a DSB site as measured by ChIP and immunofluorescence.
Cell synchronization, cell-cycle analysis, I-SceI-induced DSB, and ChIP analysis were done according to the described procedure (19, 20). The closest PCR product to the DSB site is 94–378. (A–D) Exponentially growing asynchronous cells (A); G1 phase cells (B); S phase cells (C) and; S/G2 phase cells (D). (E–H) Detection of repair proteins and hTERT at I-Sce1 site by immunofluorescence. Control cells with out I-Sec1 digestion (E); hSSB1 antibody detected as red by Alexa fluor 568 (F) and green by Alexa fluor 488 (G); control cells without digestion (H); hTERT antibody detected as red by Alexa fluor 568 (I) and green by Alexa fluor 488 (J).

