
Figure 3.
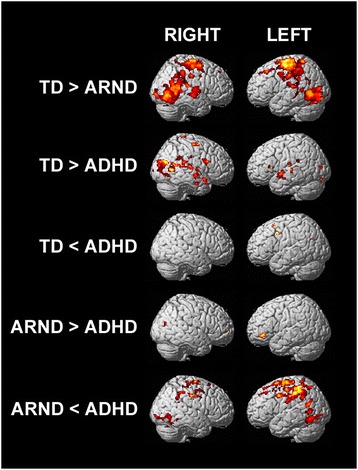
fMRI activation maps for the pair-wise comparisons of the conjunction-disjunction contrast. FWE p = 0.0167, corrected for multiple comparisons using cluster size = 12. The color of the activations corresponds to increased significance with increasingly hot colors (black-red-yellow-white); activations range from T = 1.9 to 4.4.