Figure 2.

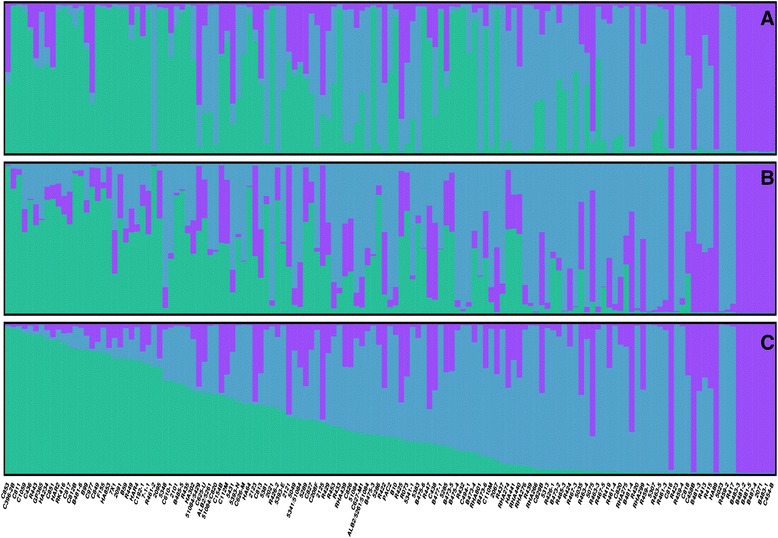
Results of STRUCTURE for K = 3. A. Population structure in the AMP-IL assessed with SSR. B. Population structure in the AMP-IL assessed with SNP. C. Population structure in the AMP-IL assessed with SSR + SNP.

Results of STRUCTURE for K = 3. A. Population structure in the AMP-IL assessed with SSR. B. Population structure in the AMP-IL assessed with SNP. C. Population structure in the AMP-IL assessed with SSR + SNP.