Figure 3.

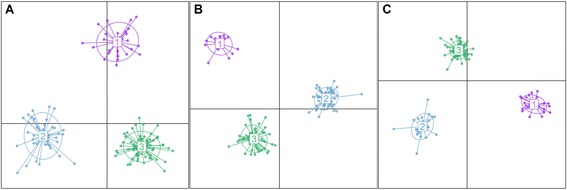
Scatter plots of DAPC showing the first two principal components. A. SSR data set. B. SNP data set. C. SSR + SNP data set.

Scatter plots of DAPC showing the first two principal components. A. SSR data set. B. SNP data set. C. SSR + SNP data set.