
Figure 1.
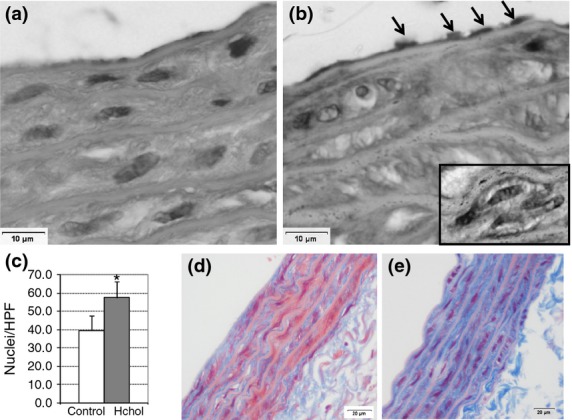
Histological analyses of aortas. Sections (8–10 μm) from aortas (n = 6 per group) from control (a and d) and high-cholesterol-fed rats (b and e) were stained with haematoxylin–eosin (a and b; original magnification 400×) and Masson′s Trichrome (d and e; original magnification 200×). Black arrows point out an area of abundant ECs. SMC hyperplasia at tunica media (c) and focal neo-intimal thickening with higher number of nuclei (black square). Nuclear counting was performed on 20 histological sections per group. *P < 0.05.