
Figure 2.
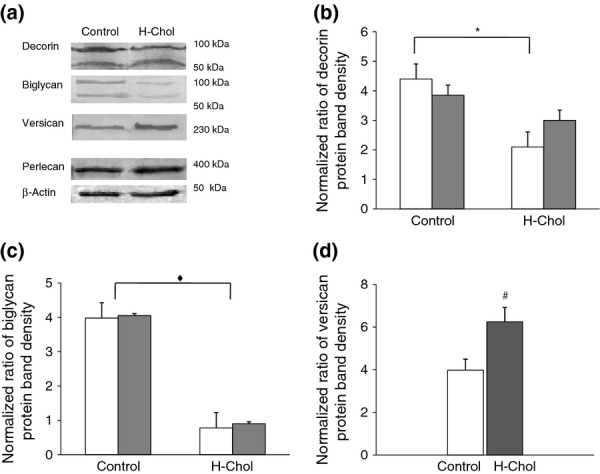
Particularly proteoglycans (PGs) expression in aortic cells. Aortic ECs and SMCs were isolated and fractionated as described in experimental procedures to obtain microsome fractions. (a) Aliquots of 30 μg of protein were separated by SDS-PAGE and transferred for PG immunological detection. A representative immunoblot for each PG shows (a) decorin (100 kDa) and its core protein (45 kDa); biglycan (100 kDa) and its core protein (45 kDa); versican, after chondroitin ABC digestion and perlecan. β-actin detection was carried out as a loading control (Weng et al. 2012). The results are representative of three separate experiments. Densitometric analysis of Western blots. (b) Each column of densitometric analysis represents the relative amount of decorin (100 kDa) – □ – and its core protein (45 kDa) – ■ – in control aortic cells and in the H-Chol group, normalized to protein content. (c) Each column of densitometric analysis represents the relative amount of biglycan (100 kDa) – □ – and its core protein (45 kDa) – ■ – in control aortic cells and in the H-Chol group, normalized to protein content. (d) Each column represents the relative amount of versican in control aortic cells – □ – and in the H-Chol group – ■ –, normalized to protein content. The average of three independent experiments is expressed as mean ± SD (n = 3) in each experiment. All microsomal fractions showed similar amount of hydrolysed inorganic phosphate as was compared with reagent blank (10.6 nmol Pi/μg protein vs. 0.3 nmol Pi/μg protein, n = 3). *Significant differences in decorin (100 kDa) production between the H-Chol group and the control group (P < 0.01). ♦ Significant differences in the production of biglycan (100 kDa) and its core protein (45 kDa) between the H-Chol group and the control group (P < 0.05). # Significant differences in versican production between the H-Chol group and the control group (P < 0.05).