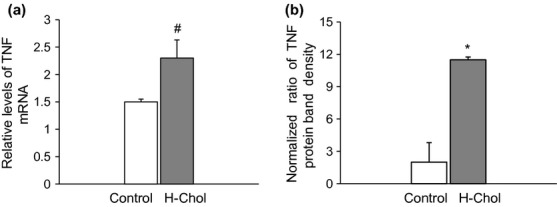
Figure 5.

(a) Analysis of TNF-α mRNA expression by semiquantitative RT-PCR. Aortic tissue was extracted as described in experimental procedures, and RT-PCR was performed with TNF-α and β-actin specific primer pairs. Each column of densitometric analysis represents the relative amount of TNF-α in control – □ – aortic tissue and in the H-Chol – ■ – group, normalized to β-actin. Results are expressed as means ± SD for duplicate samples from three independent experiments. #P < 0.05. (b) Analysis of TNF-α protein expression in isolated aortic cells by Western blot. Each column of densitometric analysis represents the relative amount of TNF-α in control – □ – aortic cells and in the H-Chol – ■ – group, normalized to β-actin protein content. Results are expressed as means ± SD for duplicate samples from three independent experiments. *P < 0.05.
