
Figure 1.
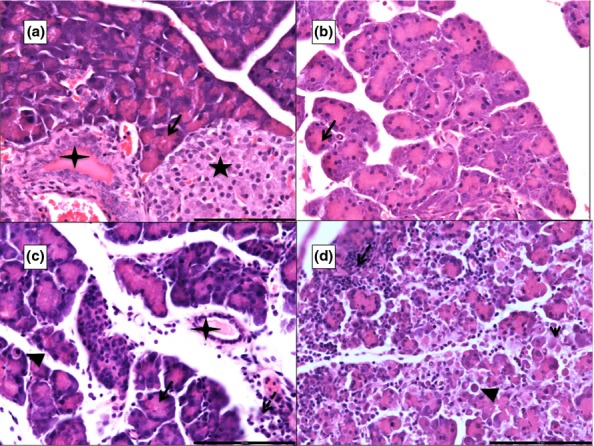
Photomicrographs of 5 μ thick H&E-stained paraffin sections of the pancreas. ‘a’ shows a control pancreas (G1) with normal acini (black arrow), islet of Langerhan (black star) and an interlobular duct (four-pointed star). ‘b’ from G2, ‘c’ from G3 and ‘d’ from G4 show varying degrees of interacinar and intercellular oedema, areas of necrosis (arrowhead), inflammatory infiltration (white dashed arrow; micro-abscess in ‘d’) and apoptosis (black arrowhead). Scale bars: a = b = c = d = 100 μm.