
Figure 4.
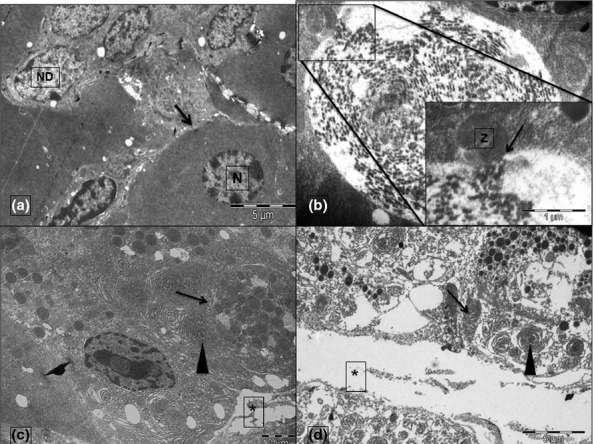
Transmission electron micrographs from G1 (a), G2 (b), G3 (c) and G4 (d). The nuclei of an acinar cell (N) in ‘A’ have been shown to be distinct from the nuclei of ductal cells (ND). The black arrows in ‘a’ point to the intact basement membrane that is not seen in ‘d’. Asterisks (*) in ‘c’ and ‘d’ mark the interstitial oedema. Autophagosomes have been marked by arrows in ‘c’ and ‘d’. The inset in ‘b’ displays the magnified view of the docking of a zymogen granule (Z) with the autophagosome (arrow). The rough endoplasmic reticulum (arrowhead) appears whorled and expanded in ‘c’ and ‘d’. Scale bars: a = 5 μm, b = 1 μm, c = 2 μm and d = 5 μm. Inset scale bar = 1 μm.