
Figure 3.
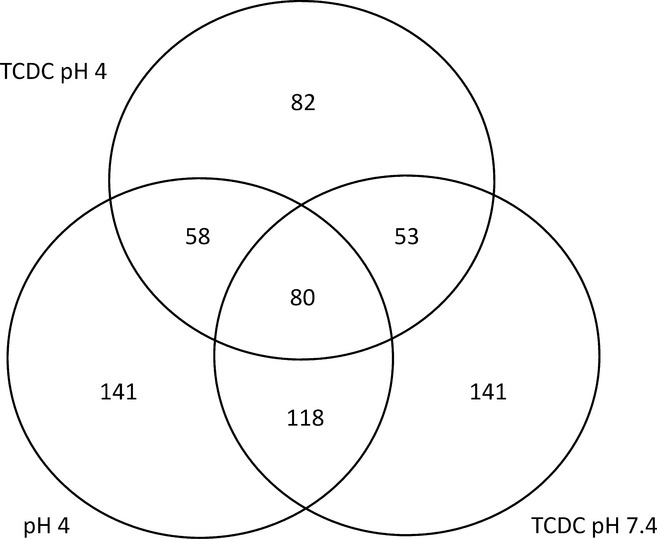
Venn diagram with values indicating the number and extent of overlap for the differentially expressed genes in the epithelium of the oesophageal model following pulsatile exposure to acid and/or taurochenodeoxycholate compared to the control. Results are given for posterior probability of positive log ratio <0.3 or >0.7.