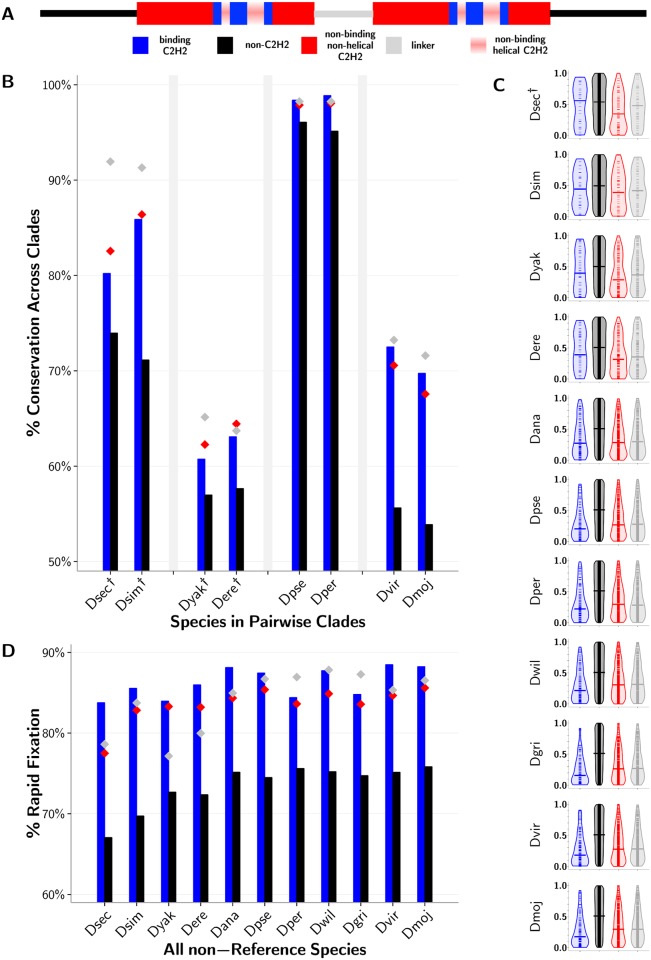
Fig 4. Functional importance of C2H2-ZF gene residues.
(A) Legend depicting a sequence with non-C2H2-ZF domain residues (black), residues in non-binding regions of the C2H2-ZF domain outside of the alpha-helix (red), the four DNA-binding residues in the alpha-helix (blue), and linker regions between adjacent canonically linked C2H2-ZF domains (gray). Positions 1, 4, and 5 in the alpha-helix (pink) are not included in the analysis because while they are typically not DNA binding, they are found in the recognition helix. (B) Percent of divergent residues for each of the four previously described residue classes with a matching mutation in the most closely paired species. Closely-related pairs of species are grouped on the x-axis. Residues corresponding to DNA-contacting residues (blue) and background residues (black) are represented as bars for visual purposes only, emphasizing the trend that DNA-contacting residues are more often conserved across clades than are background residues. Corresponding values for linker (gray) and non-binding C2H2-ZF (red) residues are represented as colored diamonds. Differences between the DNA-binding and background residues that are not significant at the p < 0.001 level using a binomial test are marked by daggers (†). (C) Ranks of divergent residues based on evolutionary rate as predicted by Rate4Site [55] that have been 0-to-1 normalized. These plots are violin plots, where the dynamic widths of the violins correspond to the relative density of points in the distribution, and the medians are given by horizontal lines. The areas of the violins are equal per plot. Differences between the binding and background residues are calculated using a Wilcoxon test, and those differences that are not significant at the p < 0.001 level are marked by daggers. (D) Percent of residues found to diverge between D. melanogaster and each other fly species that did not correspond to a polymorphic site in D. melanogaster population data. Values for different residue types as well as significance between DNA-binding and background residues as calculated using a binomial test are both represented as in panel B. Exact p-values for all species, ranging from approximately 0.2 to 1e-22 (Part A), 0.02 to 1e-56 (Part B) and 1e-16 to 1e-165 (Part C) can be found in S1 Table.

