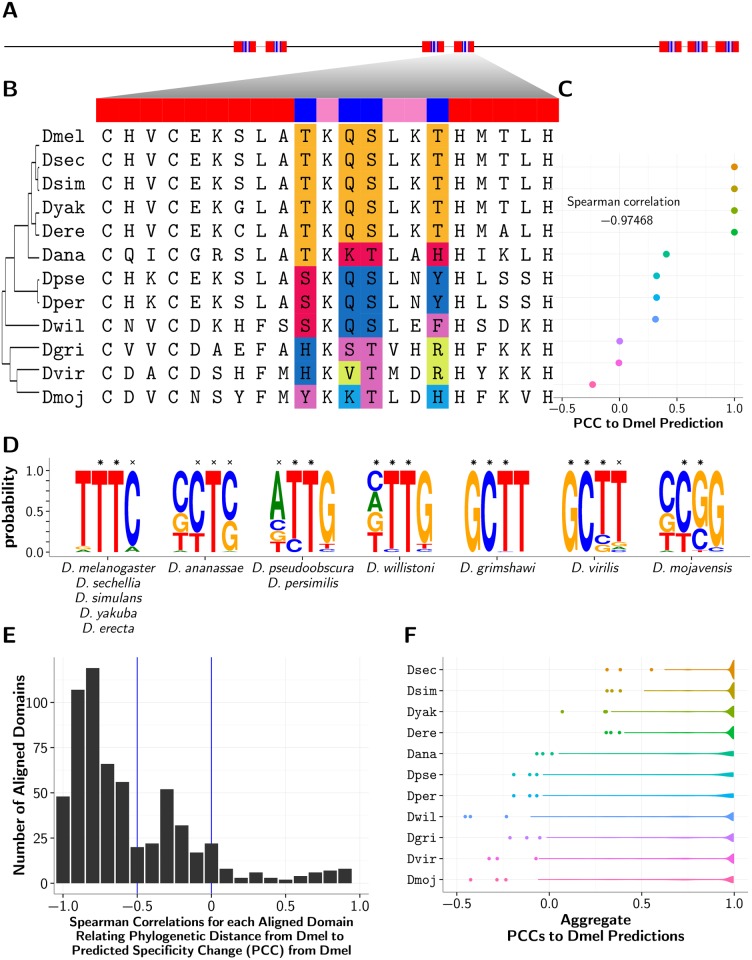
Fig 5. Example of a varying D. melanogaster C2H2-ZF domain.
(A) Layout of the seven C2H2-ZF domains in D. melanogaster protein FBpp0072605. All domains are found in three canonically linked arrays of sizes 2, 2, and 3 respectively. Both domains in the middle array and domains 2 and 5 located at the end of the first array and start of the last array also exhibit divergent binding residues. (B) Closeup of the 4th domain in the protein, with phylogenetic tree and multiple alignment of the aligned domains from the other fly species. (C) Average (across positions b1–b4) Pearson correlation coefficients (PCCs) between non-reference and D. melanogaster SVM predicted specificities by species. The Spearman correlation, relating non-melanogaster predicted specificity change to phylogenetic distance from reference D. melanogaster, is also shown and implies that specificity changes increase gradually with distance from the reference. (D) Frequency plots of the PWMs generated by WebLogo [63] representing unique binding specificities, predicted by the SVM method, ordered by phylogenetic distance from D. melanogaster, and labeled with the species whose domains had that corresponding binding specificity. Predicted positions with a PCC > 0.25 to one of either the ML or RF corresponding predictions are marked with a ×, and positions with a PCC > 0.25 to both the ML and RF corresponding predictions are marked with a *. (E) Distribution of Spearman correlations for each aligned domain (as in Part C) relating non-melanogaster predicted specificity change to phylogenetic distance from reference D. melanogaster. (F) Violin plots depicting the distributions of PCCs between predicted specificities for non-reference domains and their aligned domains in D. melanogaster orthologs.

