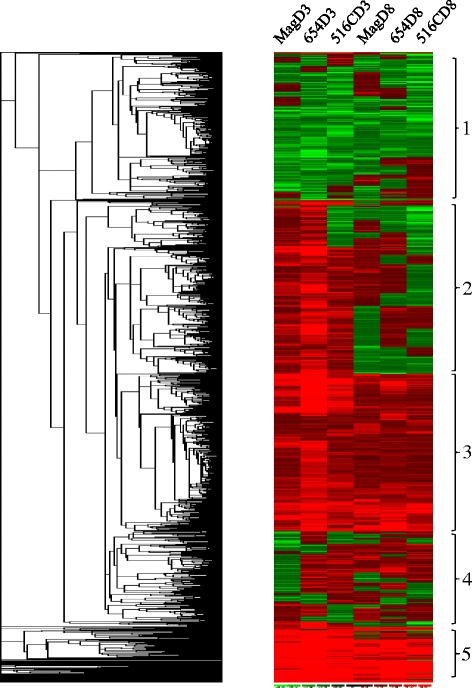
Figure 2.

Hierarchical clustering of the SCN-regulated genes. Each column represents a treatment and each row represents a gene. In total, 1,146 genes were regulated by SCN for at least 2 fold with a p value < 0.05. 654: PI 437654; 516C: PI 567516C; Mag: Magellan; D0: 0 day post-inoculation; D3: 3 days post-inoculation; D8: 8 days post-inoculation. Red color: up-regulation; green color: down-regulation. The numbers on the left highlight the major clades.
