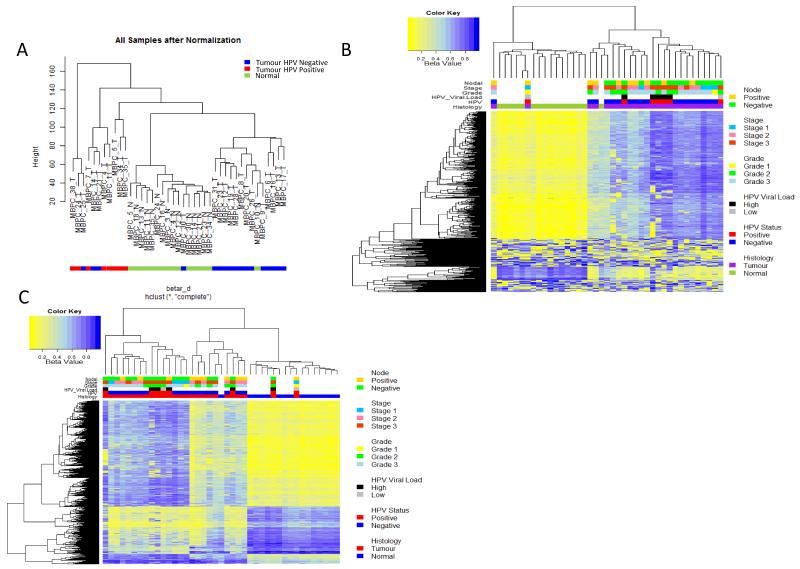
Figure1. Unsupervised clustering of methylation variable positions (MVPs) in Penile cancer squamous cell carcinomas.
A) Hierarchical clustering of PeCa and normal tissue based on global epigenetic profiles, generates 3 groups: a normal (centre, green), non-HPV-associated group (right, blue) and HPV-associated group (left, red), B) Heat map of methylation values of the 500 most variable loci, showing clear separation of normal and malignant disease. The DNA-methylation (β) values are represented using a colour scale from yellow (low DNA methylation) to blue (high DNA methylation), C) Heatmap of beta values for significant MVPs (Methylation Variable Position) (n=6933) between normal and penile cancer tissue. The DNA-methylation (β) values are represented using a colour scale from yellow (low DNA methylation) to blue (high DNA methylation.

