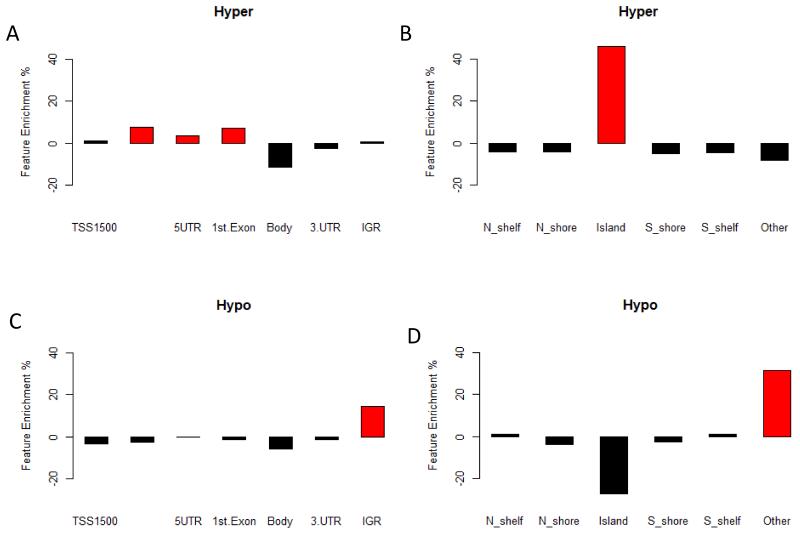
Figure 2. MVP canonical feature enrichment.
Assessment of MVP enrichment in canonical gene features, for both hyper- (A and B) and hypo- (C and D) methylated MVPs. Shows enrichment of hypermethylated MVP in promoter associated features (A) and CpGI (D), Hypomethylated MVP are enriched in inter-genic regions (IGR) (C). Genomic features with significant (P=<0.0001) enrichment are shown in red.

