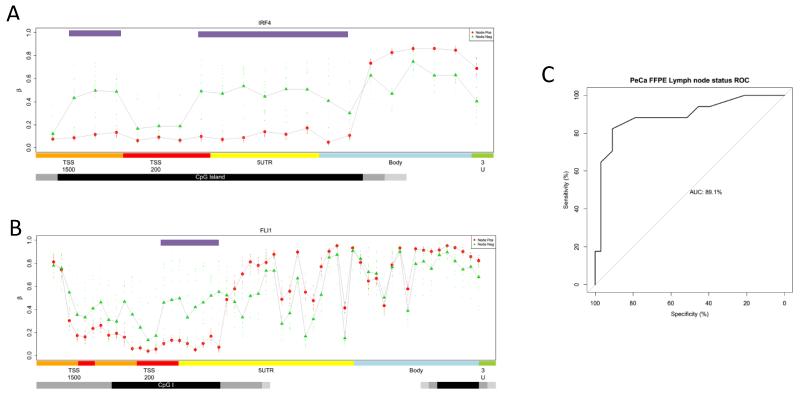
Figure 4. Epigenetic genomic profiles of DMRs associated with lymph node metastasis.
Methylation profiles of candidate genes associated with local lymphatic metastases, for A) IRF4 and B) FLI1. Feature annotation are taken form the Infinium methylation arrays, methylation values are color-coded accordingly: TSS1500, orange (1500 bp to 200 bp upstream of the transcription start site (TSS)); TSS200, red (200 bp upstream of the TSS); 5′ untranslated region (UTR), yellow; gene body, blue; CpGI, black; CpGI shores, grey; and CpGI shelves, light grey. Regions defined as Differentially Methylated Regions (DMRs) are highlighted by upper purple bars. Intermarker distances are not to genomic scale. C) ROC curve for the accuracy of lymph node metastasis using the QMSP epi-signature in a 50 case validation cohort.

