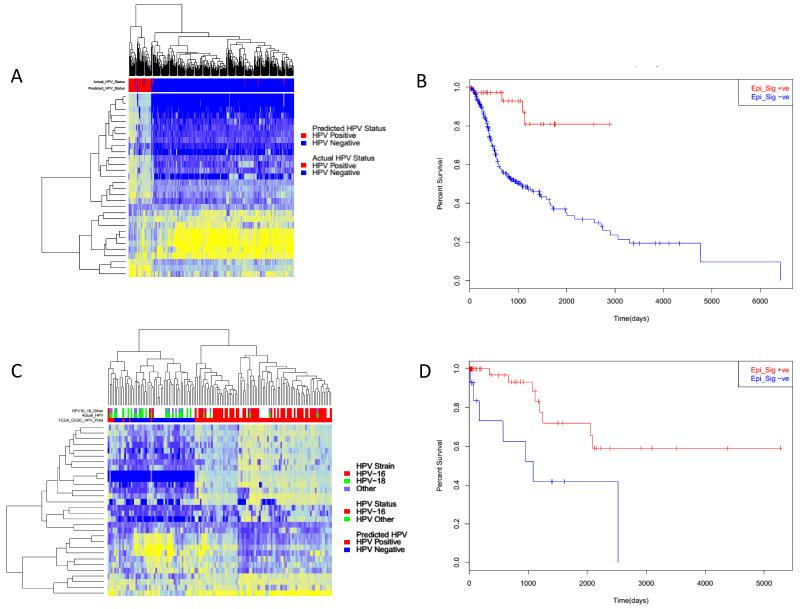
Figure 6. Analysis of HPV epi-signature in independent HNSC and CESC.
A) Heatmap of 310 TCGA HNSCC samples showing the methylation of the 30 probe set classifier. Showing the epi-signature predicted HPV status (Positive – red, Negative –blue), Actual HPV status, HPV 16 positive (red), HPV negative (blue). B) Kaplan–Meier curve showing for HNSC epi-signature positive (red) and epi-sganture negative (Blue). C) Heatmap of 136 CESC samples showing the methylation of the epi-siganutre loci. Showing the epi-signature predicted HPV status (Positive – red, Negative –blue), Actual HPV status, HPV 16 positive (red) samples containing other HPV subtypes (green), comparison of HPV sub type, HPV 16 (red), HPV18 (green) and other HPV (purple). D) Kaplan–Meier curve showing for CESC epi-signature positive (red) and epi-sganture negative (blue) patients.

