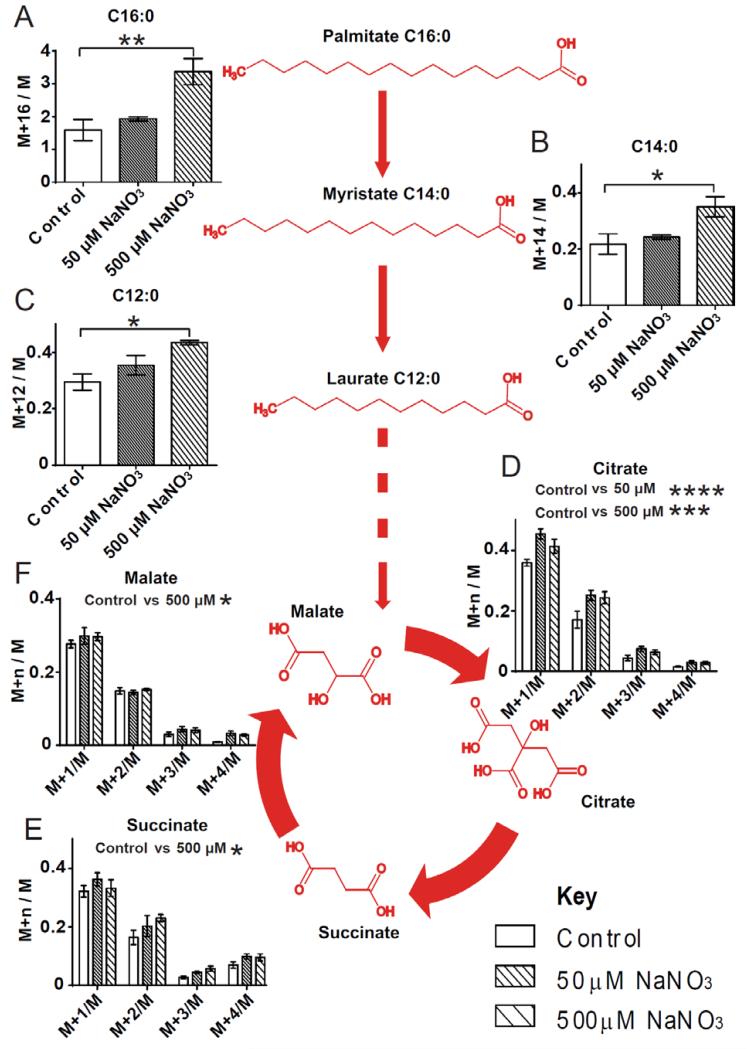
Fig. 3.
Fatty acid uptake and β-oxidation is increased in nitrate treated primary white adipocytes characteristic of the browning response. (A) 13C-enrichment of palmitate (C16:0) was significantly increased in nitrate treated adipocytes (One-way ANOVA, P ≤ 0.01). (B) 13C-enrichment of myristate (C14:0) was significantly increased in nitrate treated adipocytes (One-way ANOVA, P ≤ 0.05). (C) 13C-enrichment of laurate (C12:0) was significantly increased in nitrate treated adipocytes (One-way ANOVA, P ≤ 0.05). (D) 13C-enrichment of citrate was significantly increased in nitrate treated adipocytes (Two-way ANOVA, P ≤ 0.0001, Control vs. 50 μM NaNO3 P ≤ 0.0001, Control vs. 500 μM NaNO3 P ≤ 0.001) (E) 13C-enrichment of succinate was significantly increased in nitrate treated adipocytes (Two-way ANOVA, P ≤ 0.05, Control vs. 500 μM NaNO3 P ≤ 0.05). (F) 13C-enrichment of malate was significantly increased in nitrate treated adipocytes (Two-way ANOVA, P ≤ 0.05, Control vs. 500 μM NaNO3 P ≤ 0.05). Red highlighting indicates increased enrichment. Cumulative data from a total of 4 independent observations are shown. Data are represented as Mean ± SEM. * P ≤ 0.05, ** P ≤ 0.01,*** P ≤ 0.001, **** P < 0.0001.

