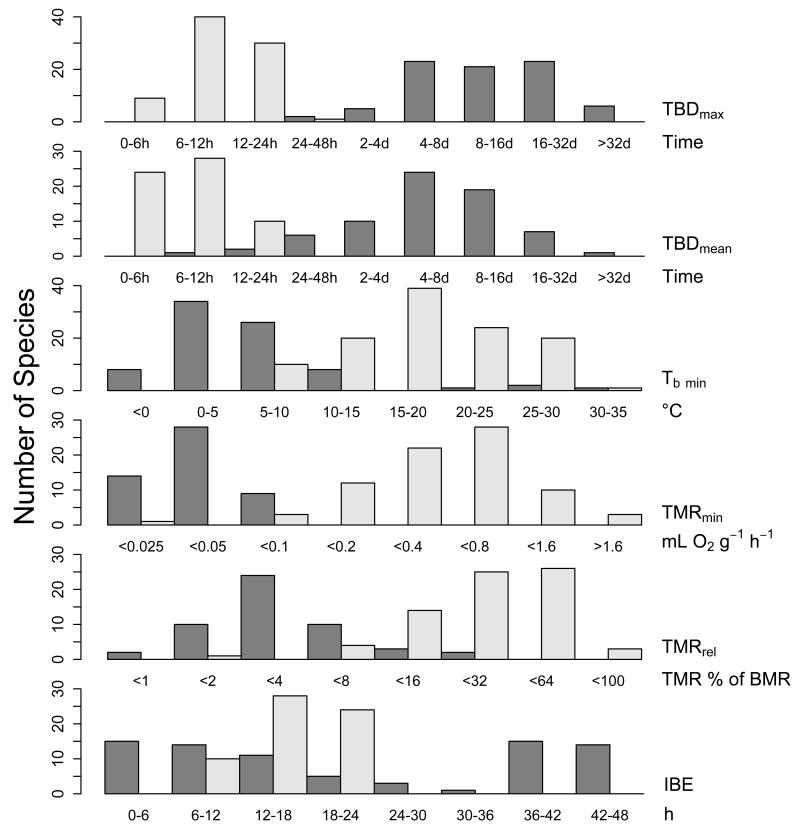
Fig. 3.
Frequency distributions of maximum torpor bout duration (TBDmax), mean torpor bout duration (TBDmean), minimum Tb in torpor (Tb min), inter-bout euthermia duration (IBE), minimum MR in torpor (TMRmin), and metabolic reduction below BMR (TMRrel). Dark bars show species traditionally classified (TBDmax<24 h) as hibernators, light bars show daily heterotherms (TBDmax>24 h). Sample size varied for different variables (see Table 2). Data from mammals and birds were combined.

