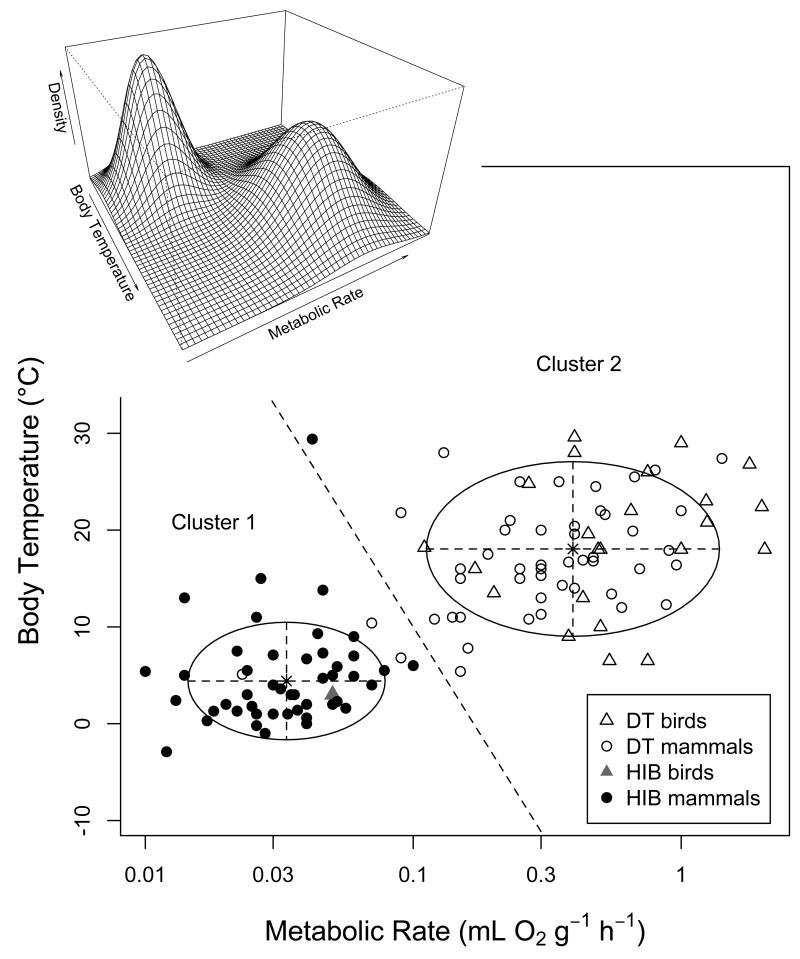
Fig. 4.
Results from a cluster analysis based on the traits TMRmin and Tb min indicating the existence of two clusters within heterotherms. Circles represent 95% confidence ellipses for the estimated cluster centres (indicated by asterisks). All species on left of the dashed line were classified as belonging to cluster 1, which was identical to our initial category “hibernators” except for three species (Elephantulus rozeti, Microcebus myoxinus, Petaurus breviceps). Species on the right of the dashed line assigned to cluster 2, which was identical to the traditonal category “daily heterotherms” except for 1 species (Ursus americanus). Overall there was a high degree of agreement (117 of 121 species) between this cluster analysis and classical categories. The inset graph shows the density surface computed from the parameters of the Gaussian mixture model.

