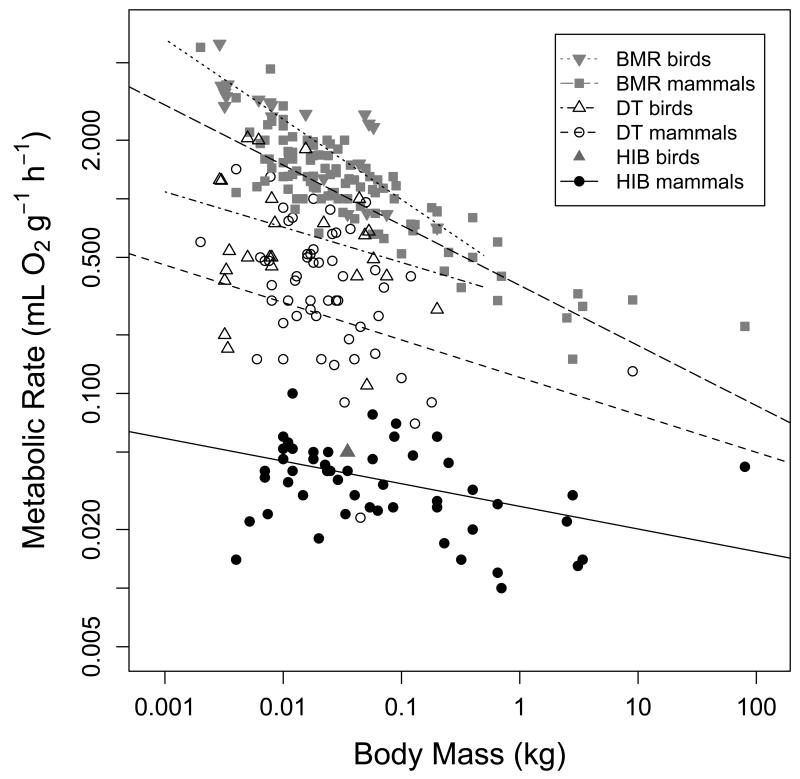
Fig. 8.
A) Basal and minimum metabolic rate as a function of body mass. Regression equations for mass specific BMR were log10BMR= −0.444 – 0.308 log10BM (t= −13.9, P<0.0001,R2=0.73) among mammals and log10BMR= −0.415 – 0.412 log10BM (t= −4.33, P<0.001,R2=0.66) among birds. Minimum MR also decreased as body mass increased in mammalian daily heterotherms (log10MR= −0.917-0.192 log10BM, t=−2.30, P=0.025, R2=0.19). In avian daily heterotherms the slope of this regression was not significantly different from zero (t=−1.17, P=0.25). Among hibernating mammals the decrease of minimum metabolic rate with body mass was not pronounced but statistically significant (log10MR= −1.579 – 0.116 log10BM, t= −4.41, P=0.0001, R2=0.13). B) The relationship between minimum torpor metabolic rate and maximum torpor bout duration. TBDmax decreased with increasing TMRmin among mammalian hibernators (log10TBDmax=1.22-0.862 log10MR, t=−4.56, P<0.0001, R2=0.20). A weaker relationship in the same direction was also detectable among mammalian daily heterotherms (log10TBDmax=0.76-0.475 log10MR, t=−3.92, P<0.001, R2=0.27), but not in avian daily heterotherms (t=−1.37, P=0.205).

