
Figure 2.
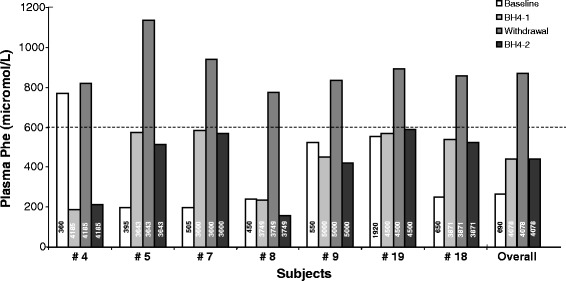
BH4 withdrawal test in 7 patients. Median Phe before BH4 therapy was calculated on Phe values collected during the 5 years prior to the enrolment into the trial (Baseline). Values reported in BH4-1 and Withdrawal represent the mean values of the Phe concentration at -10 and -5, and at +5 and +10 days from BH4 withdrawal, respectively. Patients were finally asked to re-start BH4 and to control plasma Phe levels 10 days later (day +20) (BH4-2). Numbers reported in the bars represent the daily Phe intake (mg/day) before BH4 therapy (white column) and the dietary Phe intake during the withdrawal test (dark columns). The dashed line indicates the plasma Phe upper value of the target range for the age group (600 micromol/L).