. 2015 Feb 25;15:95. doi: 10.1186/s12879-015-0827-x
© Breiman et al.; licensee BioMed Central. 2015
This is an Open Access article distributed under the terms of the Creative Commons Attribution License (http://creativecommons.org/licenses/by/4.0), which permits unrestricted use, distribution, and reproduction in any medium, provided the original work is properly credited. The Creative Commons Public Domain Dedication waiver (http://creativecommons.org/publicdomain/zero/1.0/) applies to the data made available in this article, unless otherwise stated.
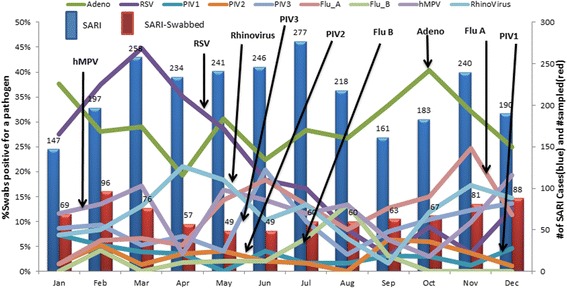
Figure 1.

Monthly (aggregate) distribution of viral pathogens, March 1, 2007-Feb 28, 2011.
