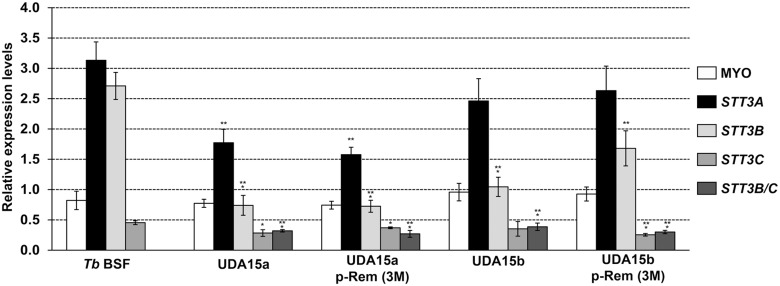
Fig 4. Relative expression of TbSTT3 genes in UDAa and UDAb-resistant cell lines.
mRNA were purified from parental and resistant lines in the presence or the absence of UDA selective pressure (p-Rem 3M), quantified by RT-qPCR and normalized to the expression of PI3K-like gene. Myosin 1B gene expression was also introduced in the analysis as control. Values were calculated from triplicates of three independent experiments. The asterisks show significant differences by the Student’s t-test (n = 3). *, p < 0.05, **, p < 0.01 and ***, p < 0.001 vs the parental strain.

