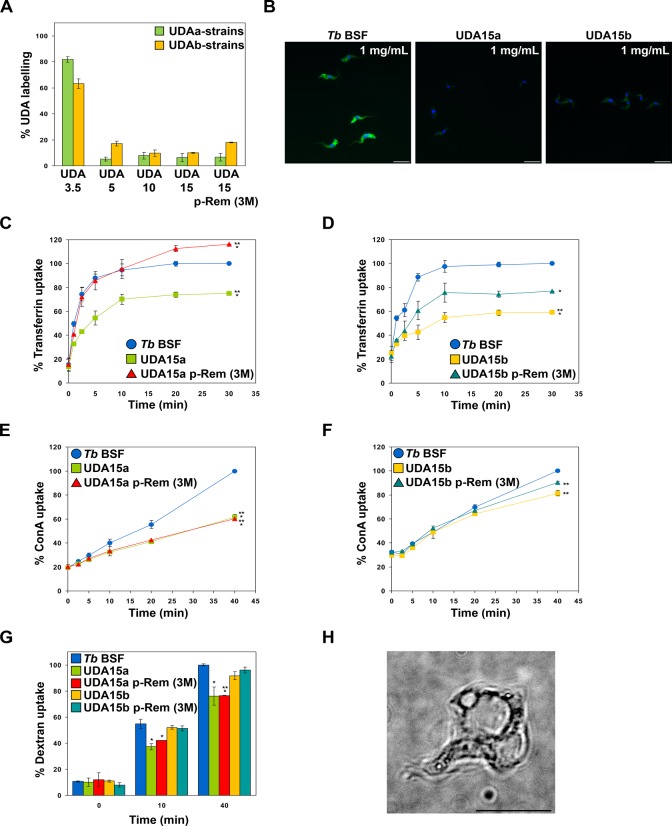
Fig 7. Resistant parasites exhibit deficient binding and uptake of UDA-FITC.
A) Plot showing binding of UDA to resistant lines grown in the presence or after 3 months of lectin removal (p-Rem 3M). Data were represented as the percentage of binding relative to the labeling of the parental line. B) Microscopy images of fixed cells showing the decrease in UDA-labeling of UDA15a and UDA15b cells in comparison to parental T. brucei BSF. Nuclear and kinetoplast DNA were stained with DAPI. Bars, 10 μm. C and D) Plots showing the uptake of transferrin in UDA15a and UDA15b lines, respectively. E and F) Uptake of ConA in UDA15a and UDA15b lines, respectively. G) Uptake of dextran. H) Live cell microscopy illustrates the “big-eye” phenotype resulting from an endocytosis block after treatment of parental T. brucei BSF with 1.125 μM UDA for 10 hours. Uptake percentages were calculated relative to the maximum uptake observed in the parental line (Tb BSF). The asterisks show significant differences by the Student’s t-test (n = 3). *, p < 0.05, **, p < 0.01 and ***, p < 0.001 vs the parental strain.

