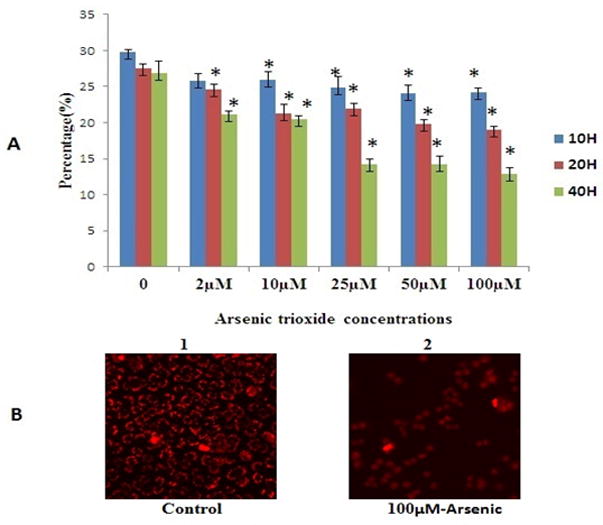
FIG. 6.

Mitochondria membrane potential (Δψm) damage was evaluated with PLHC-1 cell line using the fluorescent dye JC-1. A Quantitative analysis. B Fluorescence microscopic image. All values are represented as percentage of (n = 3) ± SEM. Asterisks indicate significant different from control (*p < 0.05)
