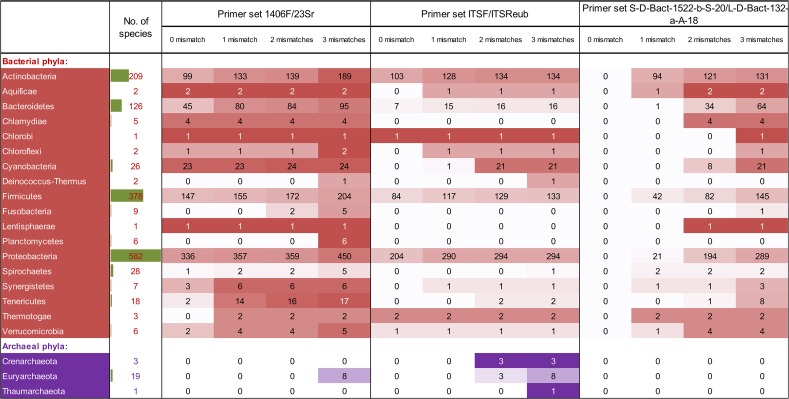
Fig 1. Number of potentially amplified species for different prokaryotic phyla in the wgs-embl-pro database revealed by ecoPCR by increasing mismatches allowed on both forward and reverse primers.
The overlaid heatmap (white = 0, darkest = maximum number of sequences) illustrates rising anticipated amplification success with increasing mismatches and was applied per row (i.e. heatmap is proportional to the sequence number available per phylum). The in-cell bar illustrates the relative contribution of the phyla in the used database.

