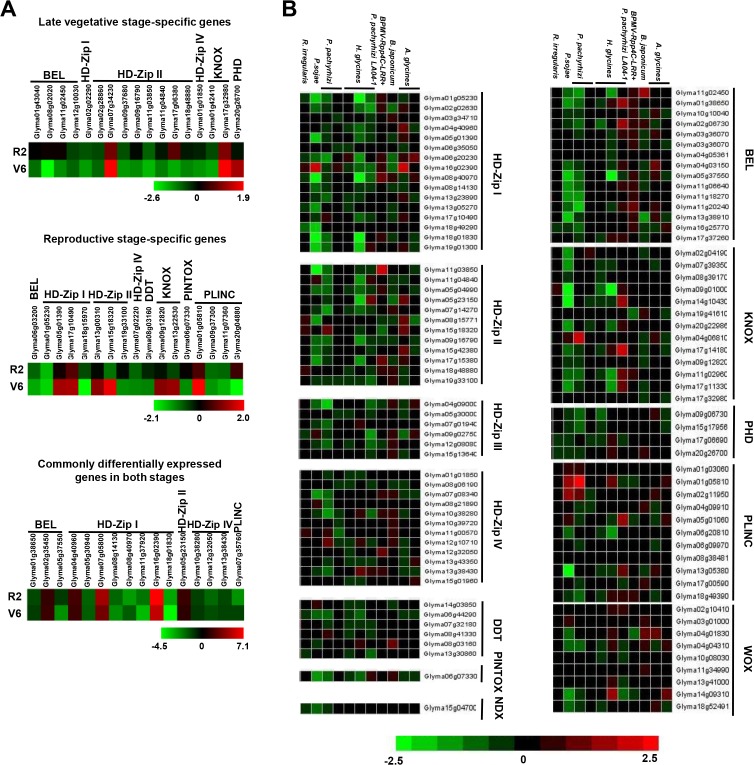
Fig 7. Differential expression of soybean homeobox genes under abiotic and biotic stress conditions.
(A) Heat-map showing differential expression patterns of soybean homeobox genes during drought stress condition at late vegetative (V6), full bloom reproductive (R2) and both stages of development. The scale at the bottom represents log2 fold change value. The maximum value is displayed as dark red and minimum value is displayed as light green. Gene IDs are given on the right side. (B) Heat-map showing expression patterns of soybean homeobox genes under biotic stresses caused by various pathogens. The scale at the bottom represents log2 ratio of expression value. The maximum value is displayed as dark red and minimum value is displayed as light green. Images have been created and retrieved by Genevestigator v.3. Gene IDs are given on the top.

