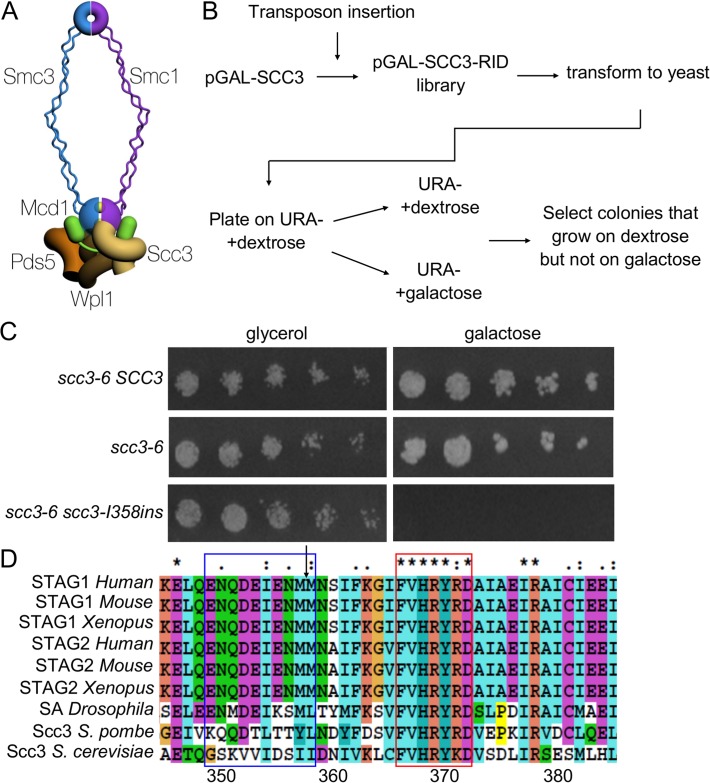
Fig 1. Identification of a functional domain in Scc3.
A. Schematic of the cohesin complex. The two yellow balls between the Smc1 and Smc3 represent ATP molecules. B. Flowchart of the experimental design to identify SCC3 dominant negative mutants. C. Strain VG3135 (scc3-6) cells carrying pRS406 (pGALURA3), pIO88 (pGAL-SCC3 URA3) or pIO88R1 (pGAL-scc3-I358insURA3) were grown to saturation in SC-URA media. Fivefold serial dilutions of each strain was plated on SC-URA plates containing either glycerol or galactose and grown at 23°C. D. Sequence alignment of Scc3 was generated by ClustalX. The arrow indicates the insertion site after I358. The blue and red frames indicate the RID A region G350-I359 and the conserved sequence F367-D373, respectively.

