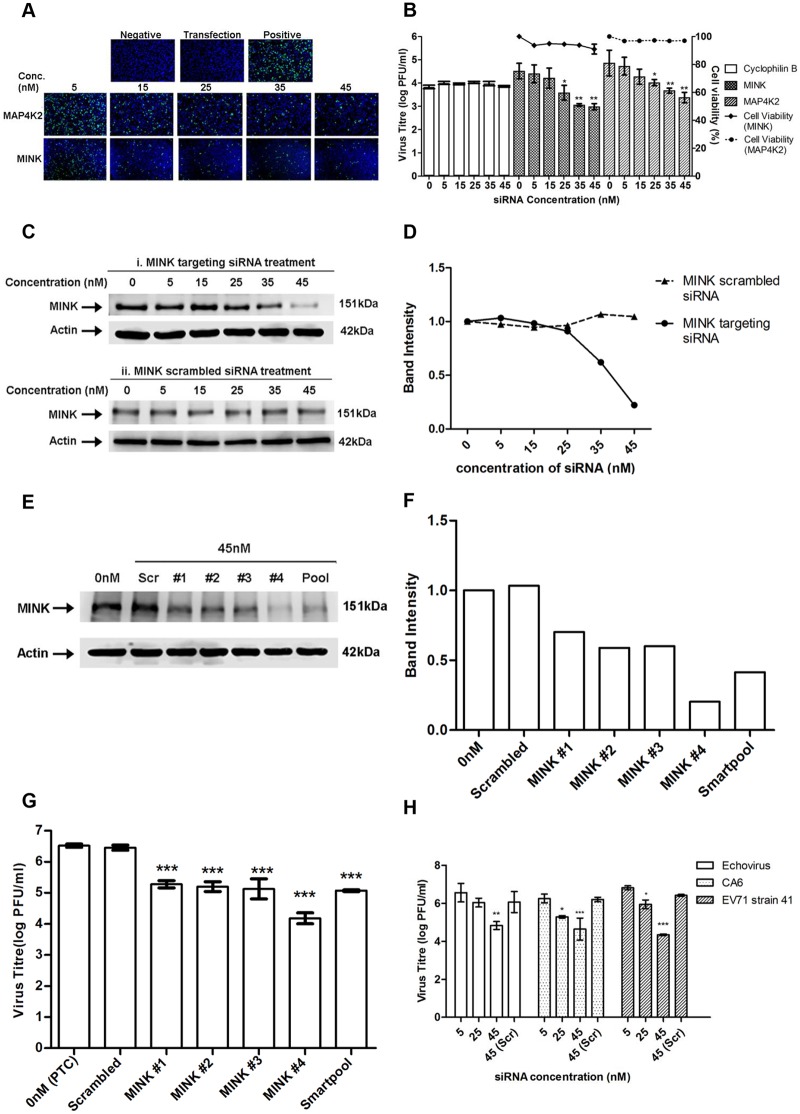
Fig 2. Silencing of MINK significantly reduced EV71 replication in a siRNA concentration-dependent manner.
(A) siRNA-treated EV71 infected cells were fixed at the same time-points and intracellular viruses were detected by immunofluorescence assay. Immunofluorescence detection of EV71 VP2 proteins (green) with the nuclei stained with DAPI (blue) is shown. The images were taken at 10X magnification. Cells in both the negative and transfection controls were not infected with EV71 while cells in the positive control were infected with EV71 in the absence of siRNA. (B) Cell viability of siRNA-treated cells was measured in relation to untreated cells using alamarBlue assay after 72h incubation. Virus titres in the supernatant of siRNA-treated cells were analysed via viral plaque assay. Error bars represent standard deviation (SD) of triplicate data and values obtained were normalised against the transfection control. Statistical analyses were performed using one-way ANOVA and Dunnett’s test (Graphpad software) against untreated control. *P <0.05 (n = 3), **P <0.01 (n = 3). (C) Verification of gene knockdown efficiency of MINK siRNA SMARTpool at concentrations ranging from 0nM to 45nM. Western blot analysis was performed to detect protein expression levels of MINK, with β-actin as the loading control. Parallel transfection of scrambled siRNA served as a knockdown control. MINK protein expression was observed to decrease in a dose-dependent manner across siRNA concentration. (D) Band intensity of MINK gene knockdown verification. The band intensities representing MINK protein expression level were quantitated with reference to actin control bands (for each individual concentration) and PTC. The intensities of protein bands were quantitated using ImageJ Gel Analysis program. (E) Verification of gene knockdown efficiency of individual siRNA within the siRNA SMARTpool directed against MINK at 45nM. Western blot analysis was performed to detect protein expression levels of MINK, with β-actin as the loading control. (F) Band intensity of MINK gene knockdown verification in deconvolution assay. The band intensities representing MINK protein expression level were quantitated with reference to actin control bands (for each individual siRNA) and PTC. (G) Virus titres in the supernatant of cells treated with individual siRNAs within siRNA SMARTpool were analysed via viral plaque assay. Error bars represent standard deviation (SD) of triplicate data. Statistical analyses were performed using one-way ANOVA and Dunnett’s test (Graphpad software) against untreated control. ***P <0.0001 (n = 3). (H) Virus titres of other human enteroviruses (Echovirus 7, Coxsackievirus A6 and EV71 strain 41) in the supernatant of siRNA-treated cells were analysed via viral plaque assay. Error bars represent standard deviation (SD) of triplicate data. Statistical analyses were performed using one-way ANOVA and Dunnett’s test (Graphpad software) against scrambled control (Scr). *P < 0.05, **P < 0.01 and ***P < 0.0001 (n = 3) versus scrambled control.

