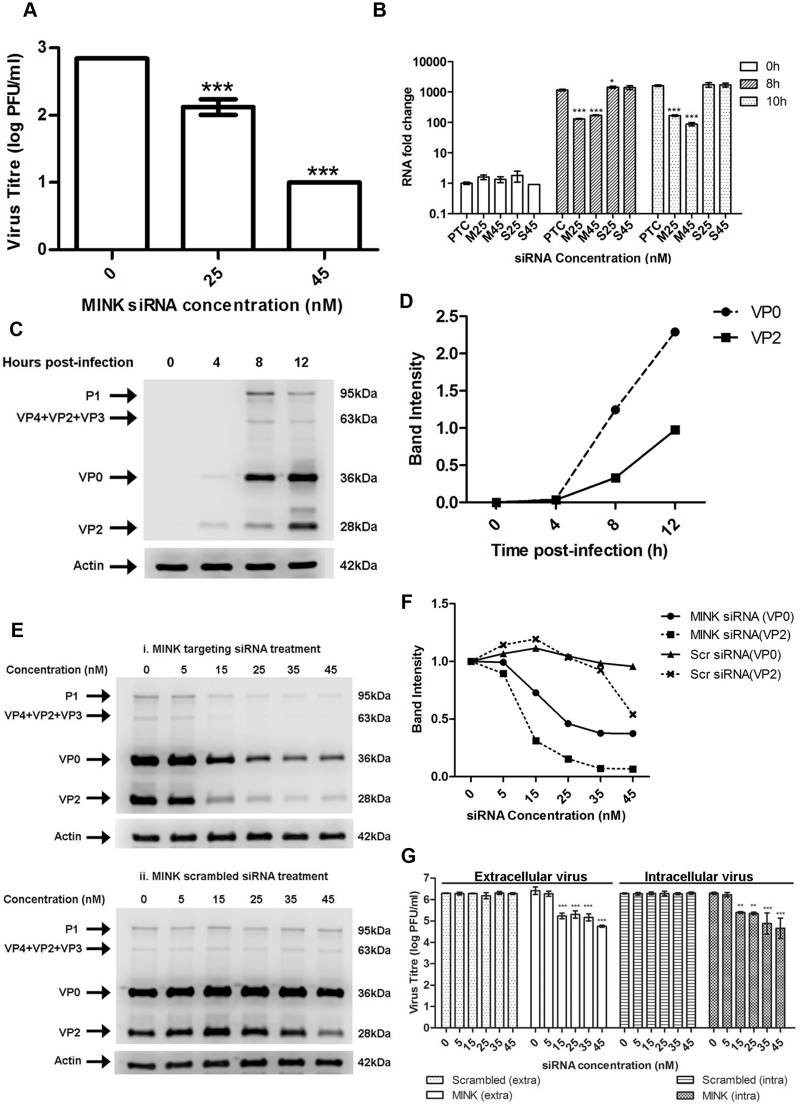
Fig 3. MINK plays an essential role in EV71 viral protein synthesis.
(A) EV71 viral RNA was transfected into RD cells pre-treated with MINK siRNA and supernatant was harvested from cells at 12h post-infection (hpi) for viral plaque assay. Silencing of MINK with targeting siRNA continued to cause inhibition of virus replication. Statistical analysis was performed using one-way ANOVA with Dunnett’s test (Graphpad software). *** P < 0.0001 (n = 3) versus untreated control (0nM). (B) EV71 RNA synthesis was sensitive to silencing efficiencies of MINK. Quantitative RT-PCR assay revealed significant reduction in levels of EV71 RNA across increasing siRNA concentration in MINK siRNA-treated cells. Total RNA was extracted for all samples at 0, 8 and 10hpi and EV71 RNA levels were measured. CT values were normalised against actin and relative quantification of viral RNA level was determined. The ΔΔCt data were calculated from three independent experiments and error bars represent standard deviation for triplicate data sets. Fold difference of viral RNA for all samples was calculated relative to the RNA level in the transfection control (PTC) at 0hpi. Statistical analyses were carried out using one-way ANOVA with Dunnett’s test (Graphpad software). *P<0.05 and *** P < 0.0001 (n = 3) vs the respective PTC at each time-point. (C) Time course study of EV71 structural protein expression via Western blot analysis. Upper band (36kDa) represents VP0 while lower band (28 kDa) represents VP2. β-actin was used as the loading control. (D) Band intensity of VP0 and VP2 in time course study. The band intensities representing VP0 and VP2 protein expression level were quantitated with reference to actin control bands (for each time-point) and 0hpi using ImageJ Gel Analysis program. (E) Viral protein expression levels upon the silencing of MINK. VP0 and VP2 viral protein expression was observed to decrease with increasing concentration of siRNA targeting MINK. (F) Band intensities of VP0 and VP2 upon siRNA knockdown of MINK. The band intensities representing VP0 and VP2 protein expression level were quantitated with reference to actin control bands (for each siRNA concentration) and 0nM using ImageJ Gel Analysis program. (G) Extracellular and Intracellular virion levels upon the silencing of MINK. Extracellular EV71 virions in the supernatant and intracellular virus particles were harvested separately at 12hpi for viral plaque assay to assess the effect of siRNA knockdown of MINK on virus packaging and release. Silencing of MINK resulted in significant reduction in both intracellular and extracellular virions. Statistical analysis was performed using one-way ANOVA with Dunnett’s test (Graphpad software). **P < 0.01 and *** P < 0.0001 (n = 3) versus untreated control (0nM).

