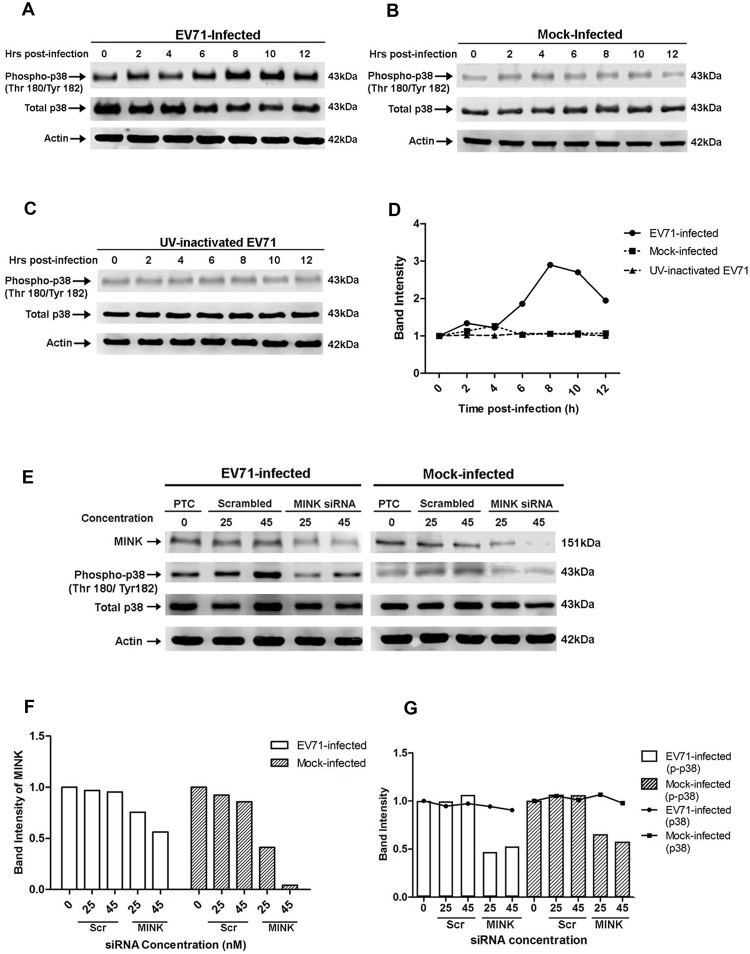
Fig 5. EV71 infection triggers p38 MAPK phosphorylation downstream of MINK.
Western blot analysis was performed to assess the levels of phosphorylated p38 MAPK (phospho-p38) at 0, 2, 4, 6, 8, 10 and 12hpi. Total p38 (t-p38) was probed as an internal control for p38 MAPK protein expression and β-actin was used as a loading control. (A) Infection with infectious EV71 was observed to activate p38 MAPK phosphorylation from 6hpi and was most significant at 8hpi. (B) Phosphorylation levels of p38 MAPK in mock-infected cells was basal and constant across the 12h. (C) Cells exposed to UV-inactivated EV71 virus also displayed basal and constant level of p38 MAPK phosphorylation of p38 MAPK. (D) Quantification of phospho-p38 MAPK (Thr180/Tyr182) protein bands. The band intensities representing phospho-p38 MAPK level were quantitated with reference to actin control bands (for each time-point) and 0hpi using ImageJ Gel Analysis program. (E) Western blot analysis of the phosphorylation levels of p38 MAPK at 8hpi in siRNA-treated cells. The left panel shows the phospho-p38 levels in EV71-infected under three different treatments: no treatment, scrambled siRNA treatment and MINK targeting siRNA treatment. The right panel shows the phospho-p38 levels in mock-infected cells under the same treatments. (F) Quantification of MINK protein bands with reference to actin control bands (for each concentration) and PTC using ImageJ Gel Analysis program. (G) Quantification of phospho-p38 MAPK (Thr180/Tyr182) and total p38 protein bands with reference to actin control bands (for each concentration) and PTC using ImageJ Gel Analysis program.

