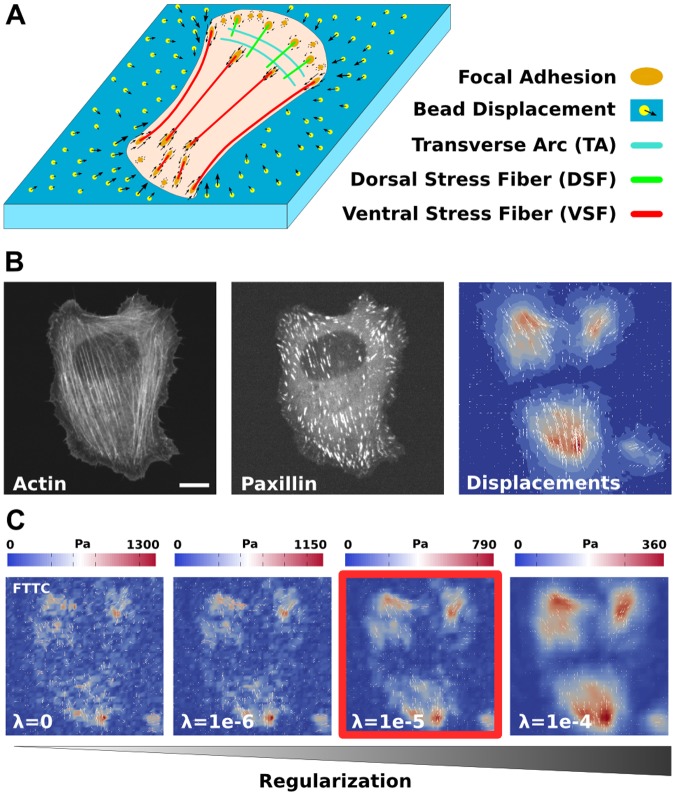
Fig 1. Actin cytoskeleton and traction force microscopy.
(A) Schematics of a cell cultured on a soft elastic substrate with embedded fluorescent marker beads. Three different kinds of stress fibers and the actin network result in forces being transmitted to the substrate through focal adhesions. (B) Experimental data for a representative U2OS-cell. Actin and paxillin images show stress fibers and focal adhesions, respectively. Displacement data is extracted form the movement of the marker beads. Scale bar 10 microns. (C) Reconstruction of the traction forces with regularized Fourier Transform Traction Cytometry depends on the choice of a regularization parameter. The standard choice based on a Bayesian estimate is marked by the red box.

