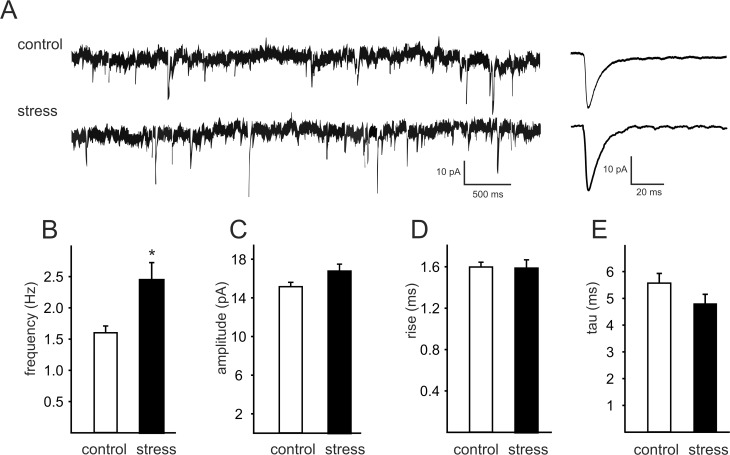
Fig 4. Prenatal stress increases the frequency of sEPSCs recorded from layer II/III pyramidal neurons.
(A) Typical examples of raw records from a control neuron (upper trace on the left) and a neuron originating from prenatally stressed rat (lower trace on the left). Traces to the right represent averages of all individual sEPSCs detected during 4 min recordings from a control neuron (upper trace) and a neuron originating from a stressed rat (lower trace). Bar graphs illustrate the effect of prenatal stress on (B) the mean frequency, (C) the mean amplitude, (D) the rise time and (E) the decay time constant of sEPSCs. In B-E, the error bars represent SEM; * p < 0.05. White bars represent neurons (n = 19) originating from control rats (n = 5) and black bars—neurons (n = 16) from prenatally stressed animals (n = 5).

