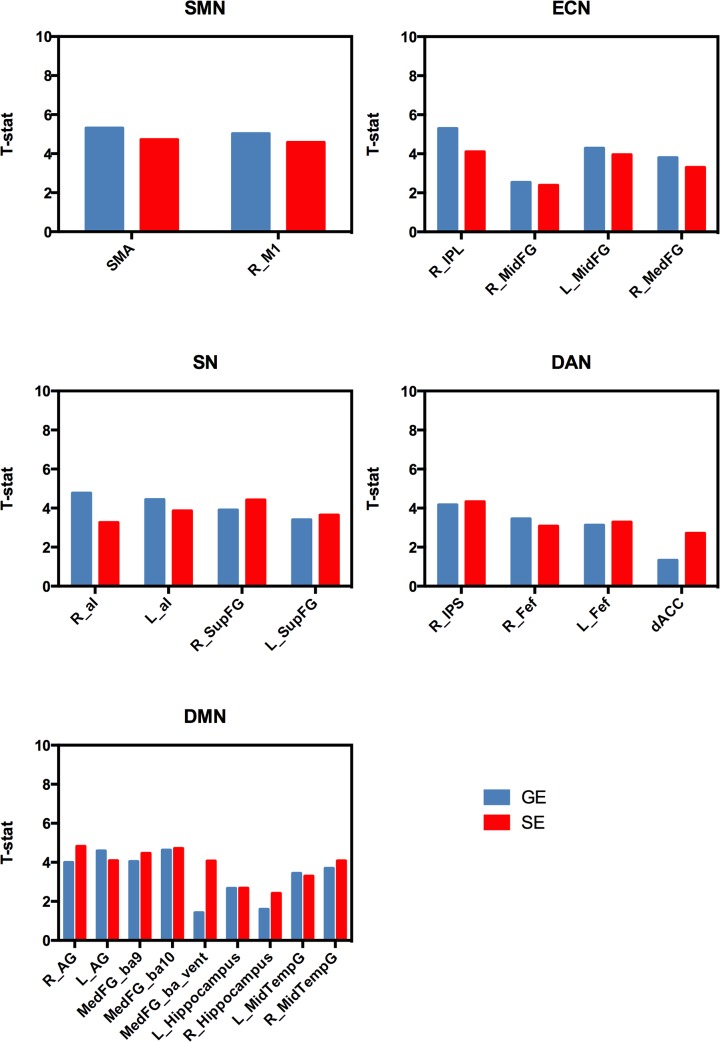
Fig 3. Statistical significance of the group connectivity maps in the different nodes.
One sample t-values were obtained averaging t-values across voxels inside each node in the random effects group connectivity maps. Note the similar t-values for GE and SE despite the reduced sensitivity of the latter.

