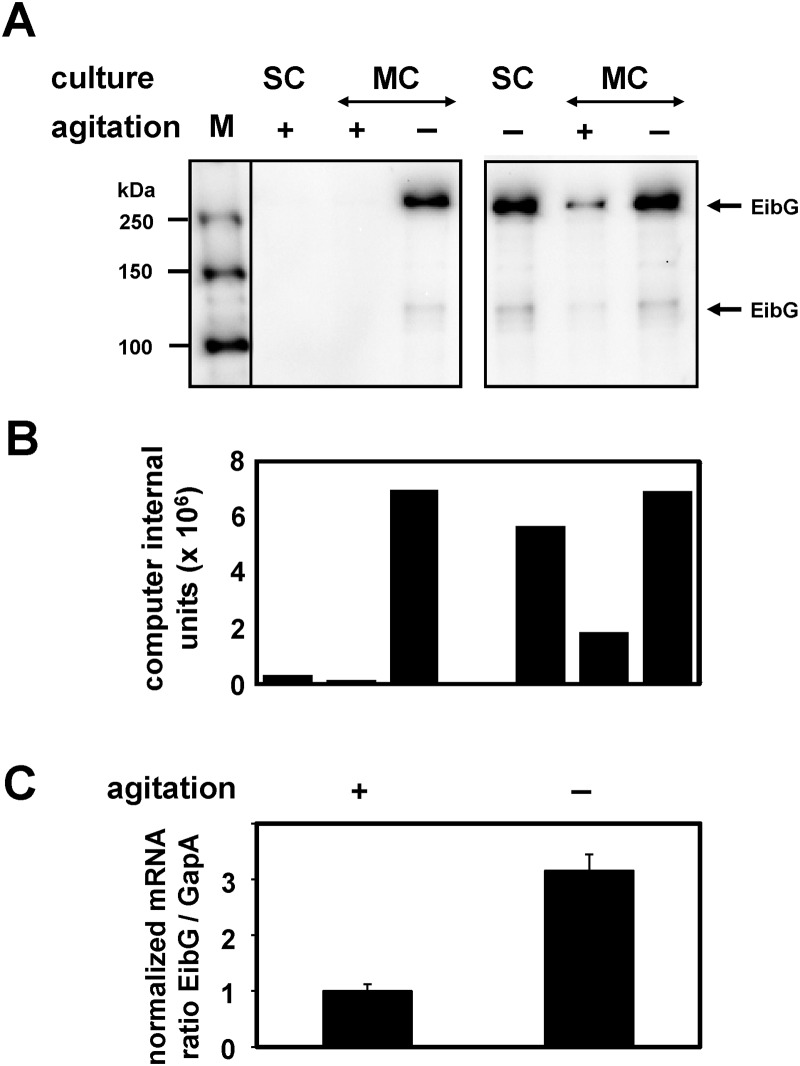
Fig 3. EibG expression is regulated by motion.
Single colonies of strain 2875/96 were grown as starting culture (SC) in LB for 18 h with (+) or without (-) shaking. Cells were inoculated at a 1:100 dilution indicated as main culture (MC) to fresh LB medium followed by incubation with or without shaking, respectively. Proteins of grown cells (1 μg per lane) were separated by SDS-PAGE and immunoblotted. (A) EibG signals were visualized using human IgG Fc fragment conjugated to HRP. (B) EibG signals were quantified densitometrically and are reported as computer internal units. Values presented are representative of those from repeated growth conditions and independent gel runs. (C) After inoculation RNA was isolated for RT-PCR. The bars represent the relative levels of EibG mRNA normalized to GapA expression. Values for bacteria grown under agitated conditions (+) were defined as 1.0 and the increase of EibG mRNA was calculated after static growth (-). Samples were analysed in triplicate and results represent the means and standard deviations of the mean.

