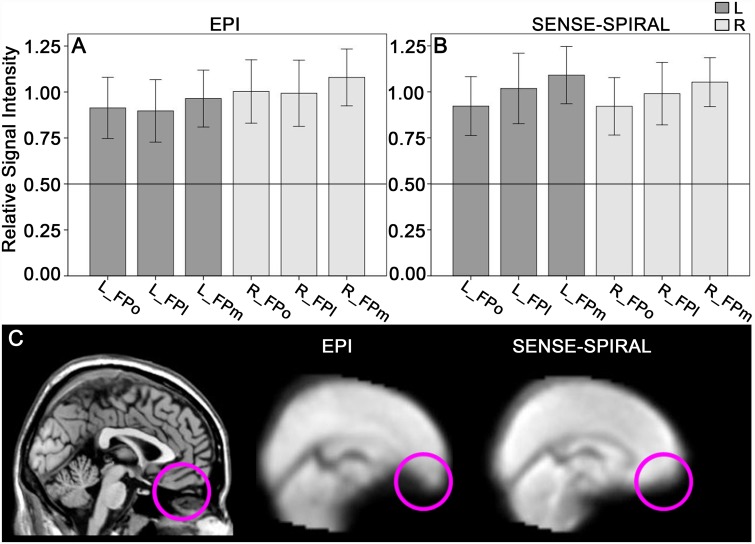
Fig 1. Assessments of signal intensity and distortion of the FP subregions.
The mean rSI of the FP subregions derived from the echo planar imaging (EPI) sequence (A) and the sensitivity-encoded spiral-in imaging (SENSE-SPIRAL) sequence (B) are both higher than 0.5. The horizontal line indicates that the rSI is 0.5. Sagittal functional images (C) show that the frontal pole and orbitofrontal cortex exhibit less distortion in fMRI data acquired by the SENSE-SPIRAL sequence than in those acquired by the EPI sequence. rSI, the mean relative signal intensity; FPo, orbital subregion of the frontal pole; FPm, medial subregion of the frontal pole; FPl, lateral subregion of the frontal pole; L, left; R, right.

