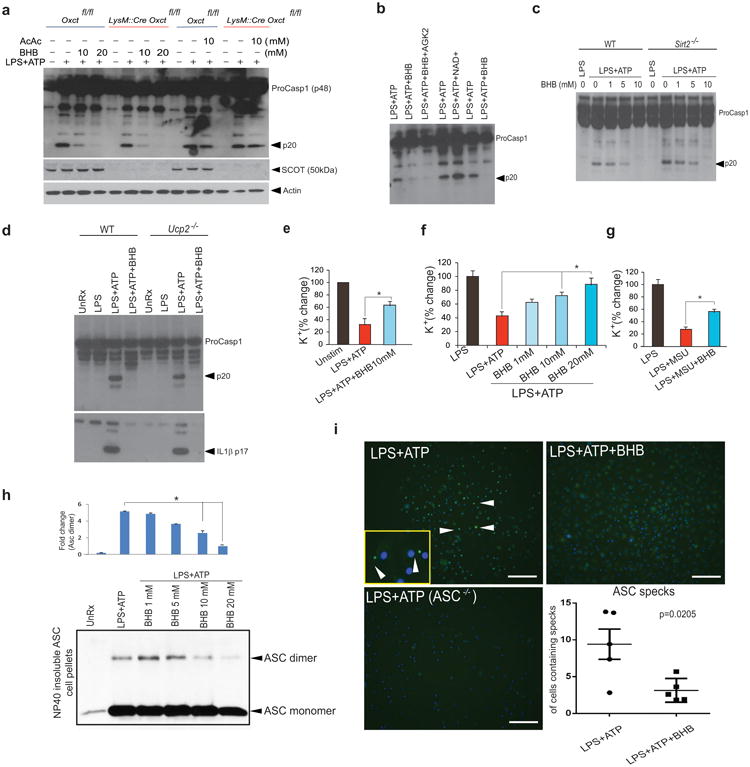
Figure 3. BHB inhibits ASC oligomerization and speck formation without undergoing mitochondrial oxidation.

(a) Western blot analysis of caspase-1 activation, SCOT and actin in BMDMs of Oxctfl/fl and LysM:Cre Oxct5fl/fl mice treated with LPS for 4h and stimulated with ATP in presence of BHB and acetoacetate. (b) Western blot analysis of caspase-1 activation in LPS-primed BMDM treated with ATP in presence of BHB (10mM), Sirt2 antagonist AGK2 (10μM) and NAD+ (10 μM).(c, d) Western blot analysis of caspase-1 activation in BMDMs of WT, Sirt2-/- and Ucp2-/- mice treated with LPS for 4h and stimulated with ATP in presence of BHB (10mM) (e) Intracellular Potassium levels in BMDMs stimulated with LPS and ATP in the presence of BHB (10 mM), as measured by Inductively Coupled Mass Spectrometry (ICP-MS). Intracellular potassium levels in LPS-primed BMDMs treated with (f) ATP, (g) MSU and BHB for 1 h. as assessed using a APG-1 dye that selectively binds potassium with an excitation emission spectra of 488-540nm. (h) Representative immunoblot analysis of disuccinimidyl suberate (DSS) cross-linked ASC in the Nonidet P-40-insoluble pellet of BMDM that were primed with LPS (4 h) and stimulated with ATP and BHB for 1 h. The bar graphs represent the quantification of band intensity of the ASC dimer compared to LPS+ATP stimulation (i) Representative immunofluroescent images of ASC speck formation in BMDMs in the presence of BHB (10mM). Data are expressed as mean ± S.E.M (*P < 0.05) from cells derived from five (a) six (b,d), eight (e-g) and four (h) mice with each independent experiment carried out in triplicate. The differences between means and the effects of treatments were determined by one-way ANOVA using Tukey's test.(i) Data are shown as mean ± SEM and are representative of two independent experiments. Statistical differences were calculated by student's t-test.
