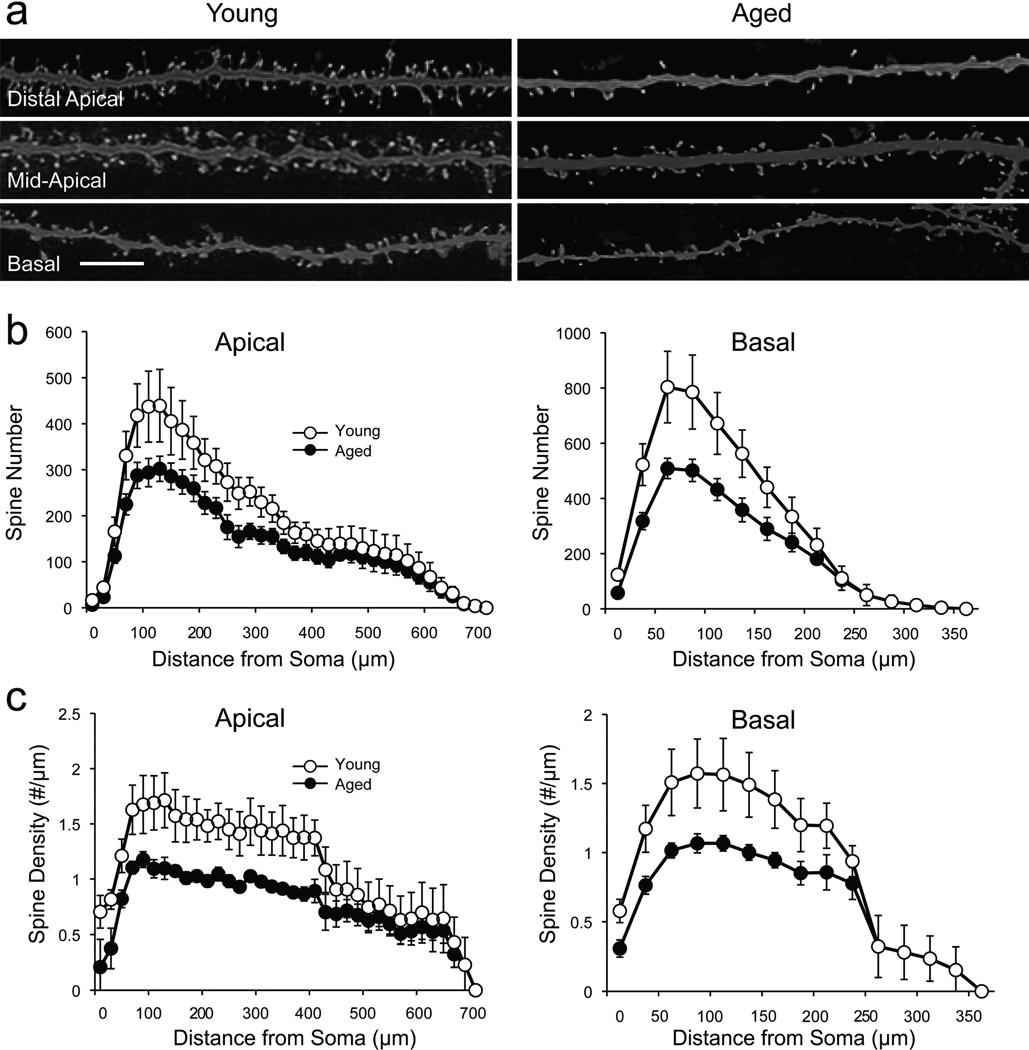
Figure 3. The number and density of dendritic spines are significantly reduced in aged neurons.
a) Confocal images of representative dendritic segments from young and aged neurons demonstrating the loss of dendritic spines in distal apical, mid-apical and basal segments. Scale bar: 4 µm. b) Distribution of mean number of dendritic spines as a function of distance from the soma in apical (left) and basal (right) dendritic trees in young and aged dendritic trees (p < 0.05 where error bars do not overlap). c) Distribution of mean density of dendritic spines as a function of distance from the soma in apical (left) and basal (right) dendritic trees in young and aged dendritic trees. Density is reported as number of spines per unit of dendritic length (p < 0.05 where error bars do not overlap).

