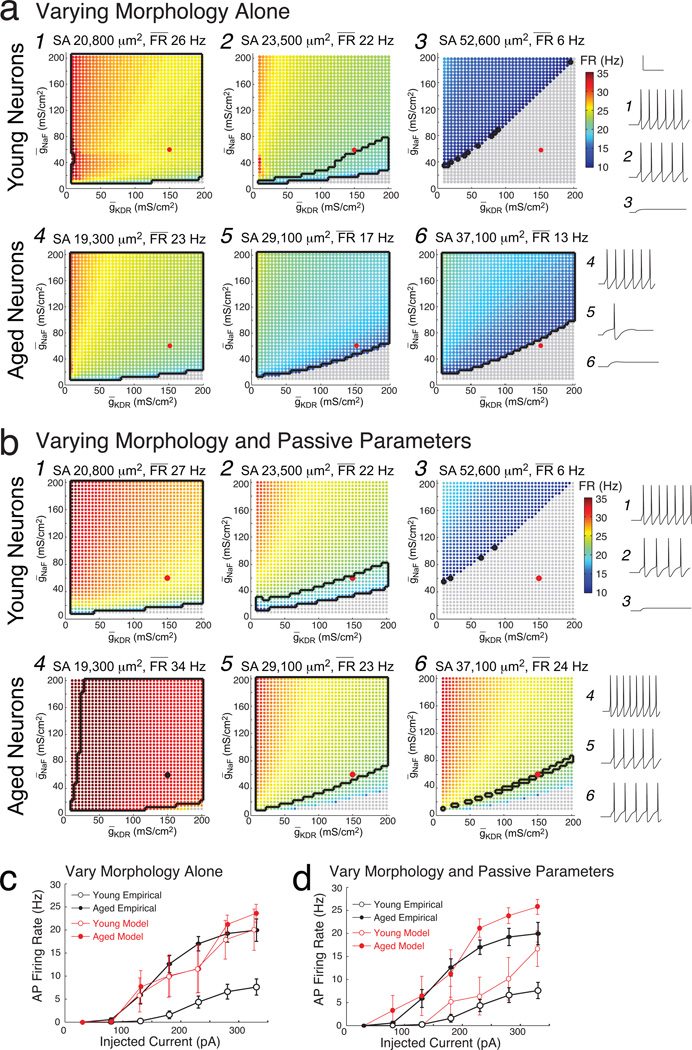
Figure 6. Influence of morphology, passive parameters, and ionic conductances on firing rates in young and aged Hodgkin-Huxley model neurons.
a) Results of the systematic searches with constant passive parameters for three young neuron models (labeled 1,2,3 here and in Fig. 2b) and three aged neuron models (labeled 4,5,6 here and in Fig. 2b). Surface area including spines and mean firing rate for each model neuron is noted above each graph. Colorscale indicates the firing rate in response to a +330 pA somatic current injection, from 10 (dark blue) to 35 Hz (red), as a function of varying values of ḡNaF and ḡKDR. Parameter combinations shown in gray fired no APs. Black contours enclose parameters whose output fit the neuron’s empirical data. Also shown are voltage traces from the model neurons, for the parameter combination (ḡNaF, ḡKDR) = (60, 150 mS/cm2) labeled as a large red dot. b) Similar graphs for the same six model neurons as in (a), with passive parameters customized for each. c) f–I curves of the mean firing rates of young and aged model neurons with constant passive parameters and (ḡNaF, ḡKDR) = (60, 150 mS/cm2), versus the mean firing rates measured empirically (in black). d) Analogous f–I curves as in (c), for models with customized passive parameters. In (c) and (d), young data are shown by open circles, which superimpose aged data indicated by closed circles.

