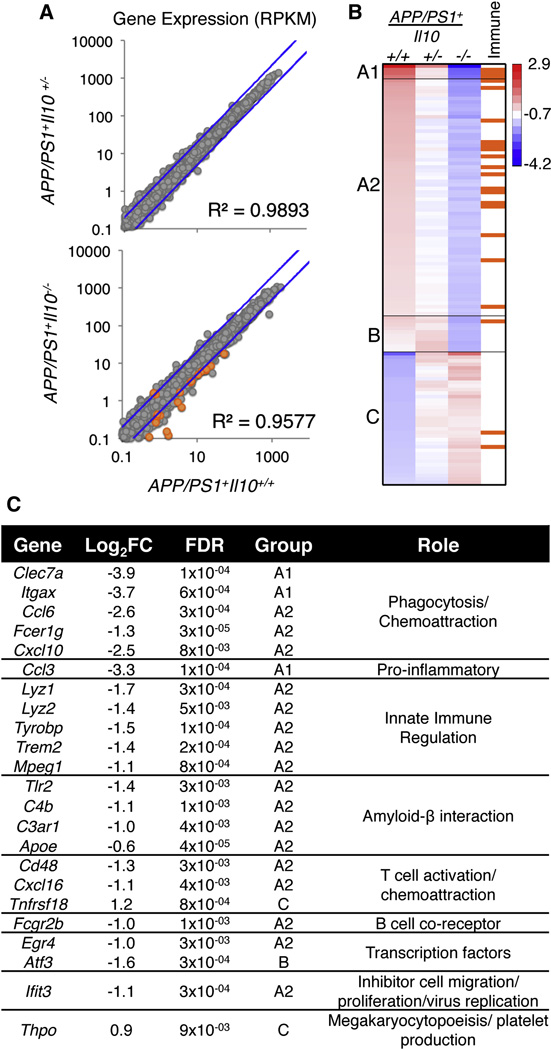
Figure 3. Transcriptome analysis of brains from APP/PS1 mice deficient in Il10.
(A) Scatterplot of the average expression per gene (RPKM) of APP/PS1+Il10+/+ (n=5) plotted against APP/PS1+Il10+/− (n=5) or APP/PS1+Il10−/− mice (n=5). The blue line represents a 2-fold change.
(B) A heat map of k-means cluster analysis of log2 transformed expression (RPKM) is shown for 117 genes with 2-fold or greater change. Genes that are immune-related (as reported by the KEGG database) are indicated in orange.
(C) A table of immune- and inflammation-related genes identified from the heat map with log2 (fold change) of APP/PS1+Il10+/+ versus APP/PS1+Il10−/− mice is shown, and false discovery rate is calculated by the edgeR package in Bioconductor. See also Figure S3.

