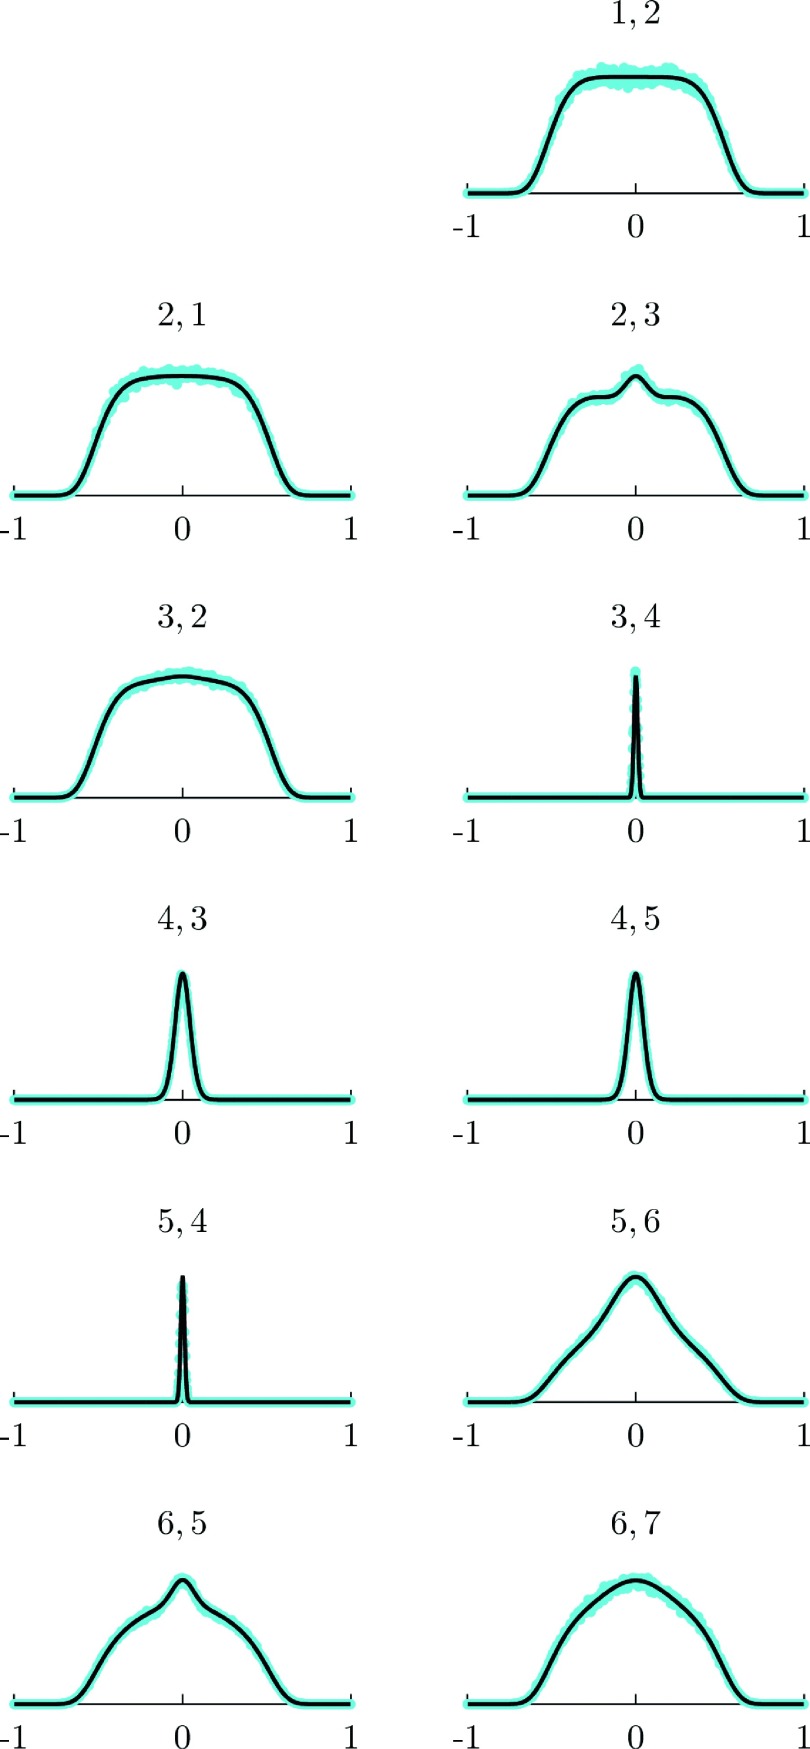
FIG. 10.
First hitting distributions between pairs of milestones are shown as a function of the coordinate in the milestone line. The pairs are indicated at the top of the panel. The solid lines are the solutions of the Fokker Planck equation. The blue dots are the results of exact Milestoning calculations. The distributions are normalized to one. See text for more details.

