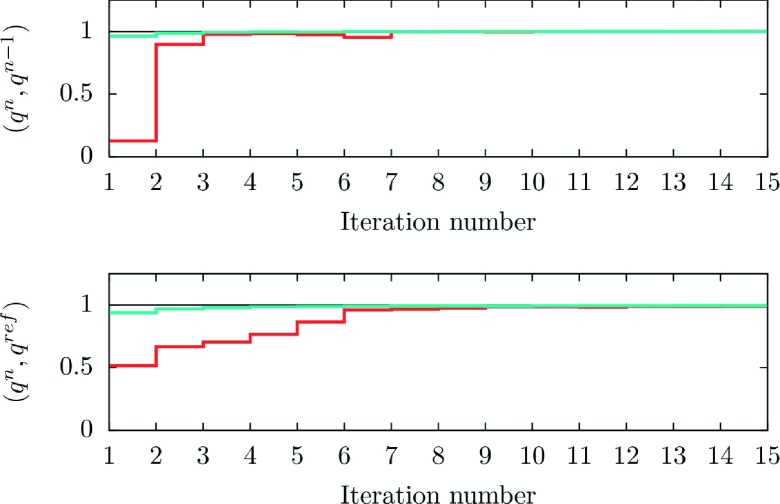
FIG. 16.
Global convergence results using Rayleigh quotients. The figure on the top displays the inner products (appropriately normalized) of the flux distributions qn−1 and qn. The graph on the bottom shows the inner product for the current iteration qn and the reference flux qref = q500. Again, the red color corresponds to the experiment where the initial trajectories are started only at the first milestone while the blue color is for the experiment where we initially run trajectories from every milestone assuming canonical distribution at each milestone.

