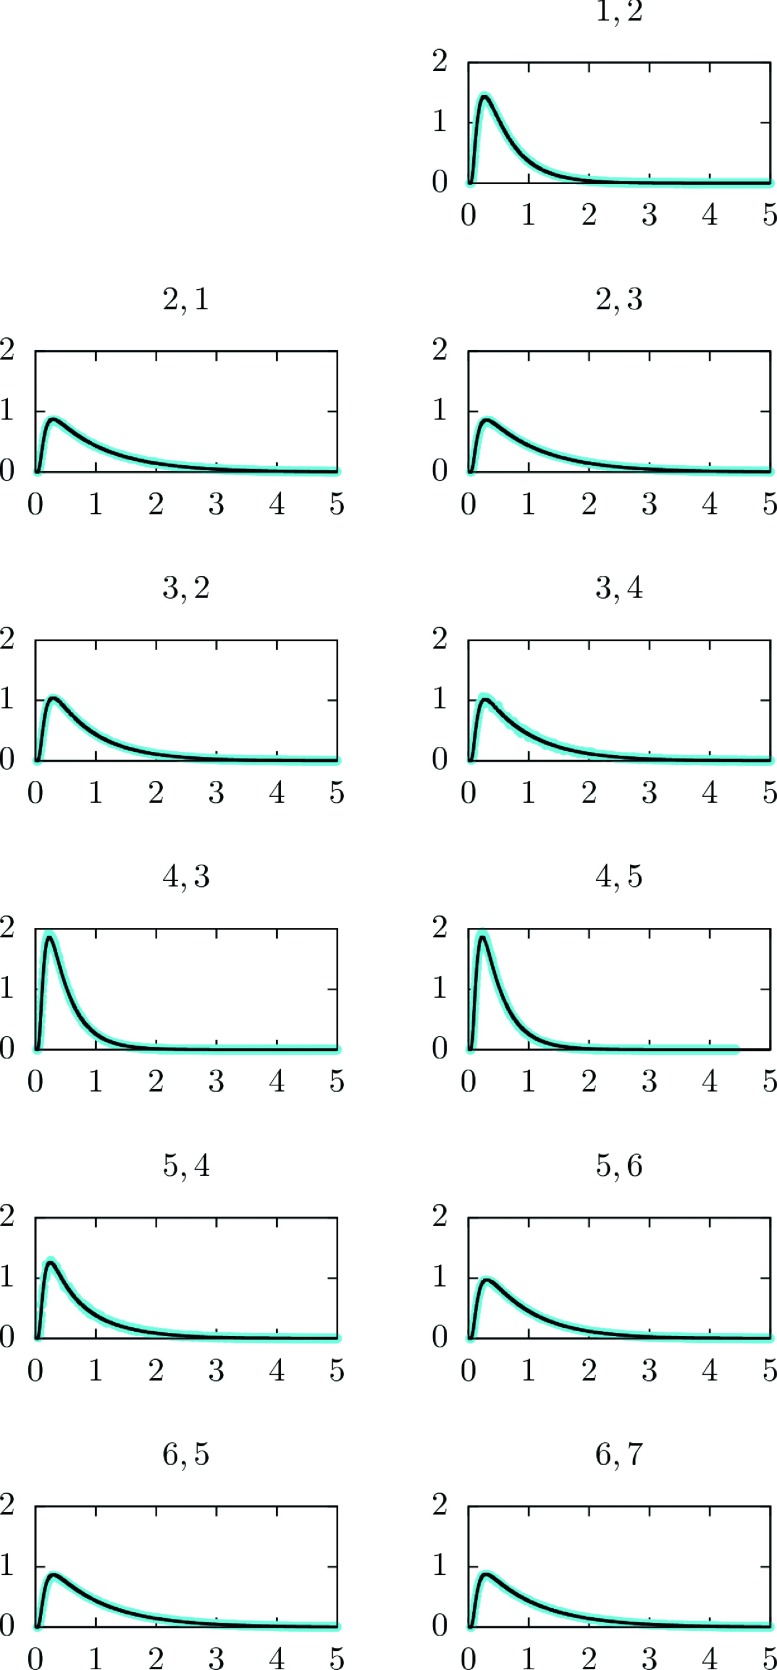
FIG. 9.
The probability densities of local transition times between pairs of milestones as a function of the transition time are shown. The indices of the milestones are indicated at the top of the panels. The black solid line is the solution of the Fokker Planck equation and the exact Milestoning are the blue dots.

